Main objective of this assignment is to analysis Physical Technique in Geography. Assignment discuss on theories and explain all this theories. Here the Name of the Experiment is Particle size analysis (sieve method) of soil sample. And the theory is – Sieve Analysis (or graduation test) is a practice or procedure used to assess the particle size distribution of a granular material.
Name of the Experiment : Particle size analysis (sieve method) of soil sample.
Experiment No. : 01
Date : 18/08/2011
Theory
Sieve Analysis (or graduation test) is a practice or procedure used to assess the particle size distribution of a granular material.
The size distribution is often of critical importance to the way the material performs in use. A sieve analysis can be performed on any type of non-organic or organic grander materials including sands, crushed rock, clays, granite, feldspar, coal and soil, a wide rang to manufactured powders, grain and seeds, down to a minimum size depending on the exact method. Being such a simple technique of particle sizing, it is probably the most common.
Importance of soil particle size analysis:
Soil gradation is very important to geotechnical engineering.
- It is an indicator of other engineering properties such as- compressibility, shear strength and hydraulic conductivity.
- In a design, the gradation of the in situ or on site soil often controls the design and ground water drainage of the site.
- A poorly graded soil will have better drainage than a well graded soil because there are more void spaces in a poorly graded soil.
- When a fill material is being selected for a project such as a highway embankment or earthen dam, the soil gradation is considered.
- A well graded soil is able to be compacted more than a poorly graded soil.
- When options for ground remediation techniques are being selected, the soil gradation is a controlling factor.
Procedure:
- A representative weighed sample is poured in to the top sieve which has the largest seren opening. Each lower sieve in the coloumn has smaller opening than the one above. At the base is a round pan, called the receiver.
- The coloumn is shaked by had usually for some fixed amount of time. After the shaking is completed the material on each sieve is weighted. Then the weight of the sample of each sieve is divided by the total eight to give a percentage retained on each sieve.
- The size of the average particles on each sieve is analyzed to get the cut point or specific size range captured on screen.
- At last the result was displayed by plotting the percent passing (on a linear scale) and connecting the plotted points with a smooth curve referred to as a grain – size distribution curve.
Calculation & Result:
Mass of empty patrisdis = 46 gm
Mass of patrisdis with soil sample = 122 gm
Mass of soil sample = (122 – 46) gm
= 76 gm = W Total
The calculation of W sieve has been presented in the table below:
Table – 01 : Particle size distribution (PSD) of soil sample
| Sl. No. | Particle size | Mass of empty Patrisdis (gm) | Mass of Petridis with soil smaple (gm) | Mass of W Sieve (gm) |
| 7 | >1.70 | 46 | 73 | 27 |
| 6 | 1.00-1.70 | 46 | 58 | 12 |
| 5 | .50-1.00 | 46 | 64 | 18 |
| 4 | .25-.50 | 46 | 57 | 11 |
| 3 | .24-.50 | 46 | 51 | 5 |
| 2 | .125-.24 | 46 | 47 | 1 |
| 1 | <.125 | 46 | 46.5 | .5 |
Here, W sieve = (Mass of Petridis with soil sample – Mass of empty Petridis) gm
Results & Discussion:
Table – 02 : Particle size distribution (PSD) of soil sample-
| Sl. No. | Particle size Range (mm) | Percentage (%) | Cumulative % less than indicate size | Particle size discrete variable (mm) | Log (Particle size) |
| 7 | <.125 | 0.657 | 0.657 | .125 | -0.9030 |
| 6 | .125-.240 | 1.315 | 1.972 | .240 | -0.6198 |
| 5 | .240-.250 | 6.578 | 8.55 | .250 | -0.6020 |
| 4 | .250-.500 | 14.473 | 23.023 | .500 | -0.3010 |
| 3 | .500-1.00 | 23.684 | 46.707 | 1.00 | -0.000 |
| 2 | 1.00-1.70 | 15.789 | 62.496 | 1.70 | 0.2304 |
| 1 | >1.70 | 35.526 | 98.22 |
Next
The results are presented in a graph of percent passing versus the sieve size. On the graph the sieve size scale is logarithmic. To find the percent of aggregate that is retained in each sieve and the amount in the previous sieves, first it has to find the percent in each sieve. To do so, the following equationis used –
% Retained = W Sieve/W Total x 100
Here, W sieve = The weight of aggregate in the sieve
W Total = The total weight of aggregate
Total next step is to find the cummulative percent of aggregate pertained retained in each sieve. To do so, the total amount of aggregate that is retained in each sieve and the amount in the previous sieve is to add up. The cummulative percent passing of he aggregate is found by subcontracting the percent from 100%.
% Cumulative passing = 100% Cumulative retained.
Conclusion:
From above result analysis, we can say easily that most of the particle size of soil sample are sand. Because, we know from the classification of soil according to their particle size that, the range between (0.05 mm- 2 mm) particle size are called sand. From the experiment we see that all the particle size are considered within the range, written above. So, it is easy to say that our soil sample was sandy soil.
Name of the Experiment : Measurement of soil Humidity / Moisture text of soil.
Experiment No. : 02
Date : 18/08/2011
Theory:
Soil loosely the earth or ground but specially the loose materials of the earths surface in which terrestrial plants grow, usually formed from weathered rock or REGOLITH changed by chemical, physical and biological processes. Thus the soil may be considered as an entity, quit apart from the rocks below it.
Soil, structure is the character of a soil shown by the ability of it’s particles to come together and to hold together to form AGGREGATES or CRUMBS and by the way they do so.
Soil humidity means the moisture in the pore spaces of a soil which is important for plant growth.
Procedure:
- At first an empty becar was taken and weighted.
- Some wet soil sample was taken in the becar and again weighted.
- Then the becar with wet soil sample was stranded on the electrode machine.
- The wet soil sample was kept on the electrode until dry.
- At last the becar with dry soil weighted.
- All the measurement were written down in the note book.
Soil Humidity Measurement:
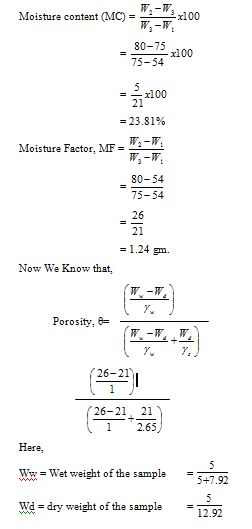
Weight of empty beear, W1 = 54 gm
Weight of wot sample + beear W, = 80 gm
Weight of dry sample + beear, W3 = = 75 gm
Wet weight of the soil sample, Ww = (w2 – w1) gm
= (80 – 54) gm
= 26 gm
And, dry weight of the soil sample, Wd = (w3 – w1) gm
= (75 – 54) gm
= 21 gm
Calculation:

w = Density of water = 0.387
s = Density of soil = 0.39
Result o& Discussion
| No | Parameters | Value (unit) |
| 01 | Weight of beear | 54 gm |
| 02 | Weight of wet sample | 26 gm |
| 03 | Weight of dry sample | 21 gm |
| 04 | Default parameters | |
| i. Solid density, s = 2.65 gm /ml ii. Density of water, w = 1 gm / ml | ||
| 05 | Results: | |
| Total porosity | 0.39 | |
| Moisture center | 23.81% | |
| Moisture factor | 1.27 gm | |
Conclusion
At last it can said that, the measurement of soil humidity or moisture test of soil is very important to analyze the characteristic of soil. Soil texture, soil structure, soil fertility etc. depends of on the amount of moisture in the soil. The amount of water in the soil will be more if pore spaces are more in the soil structure. So, porosity measurement is also important.


