Status of Photovoltaic System Designs
Major categories of PV system designs include grid-connected without storage, grid-connected with storage, and off-grid.
Grid-Connected with No Storage
The major elements of a grid-connected PV system that does not include storage are shown in Figure 2-1. The inverter may simply fix the voltage at which the array operates, or (more commonly) use a maximum power point (MPP) tracking function to identify the best operating voltage for the array. The inverter operates in phase with the grid (unity power factor), and generally delivers as much power as it can to the electric power grid given the sunlight and temperature. The inverter acts as a current source; it produces a sinusoidal output current but does not act to regulate its terminal voltage in any way.
The utility connection can be made by connecting to a circuit breaker on a distribution panel or by a service tap between the distribution panel and the utility meter. Either way, the PV generation reduces the power taken from the utility power grid, and may provide a net power flow into the utility power grid if the interconnection rules permit.
Figure (31): Grid-connected PV power system with no storage
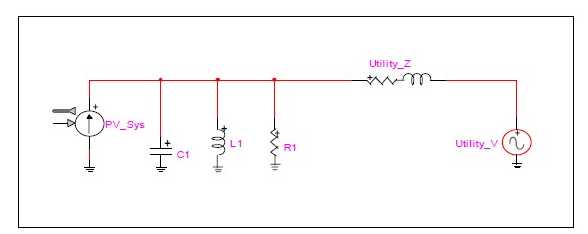
A simplified equivalent circuit of the same basic grid-connected system is shown in Figure 2-2. The PV system typically appears to the grid as a controlled current source, local loads may consist of resistive, inductive, and capacitive elements, and the utility source is represented by its Thevenin-equivalent model (voltage source Utility V with series impedance Utility Z). The local loads within a single residence rarely include much capacitance, but if a whole neighborhood is modeled at once, voltage support capacitors maintained by the utility may contribute significantly to the local load mix. This leads to conditions that could fool the inverter into running, even if the utility becomes disconnected (unintentional islanding). The utility source impedance models such things as the impedances of transformers and cables. The inverter handles all grid interface functions (synchronization, over/under voltage [OV/UV] and over/under frequency [OF/UF] disconnects, anti-islanding) and PV array control functions (MPP tracking)
Figure (32): Schematic drawing of a modern grid-connected PV system with no storage.
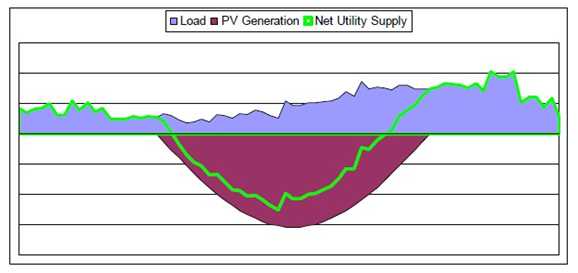
The ratio of PV system size to local load demand may be small enough that reverse power flow from the PV to the utility never occurs, but at high penetration the magnitude of the reverse power flow at midday is likely to exceed the magnitude of the nighttime load power. As shown in Figure (32), if we try to make the generation energy (area of red hump) equal to the load energy (blue area), the daytime power production (peak of red generation hump at solar noon) is likely to exceed the peak load power flow because most loads draw power all night when the PV system cannot supply power. For this residential load example, the peak load power flow is a double peak in late evening, which highlights the time misalignment that can occur between residential load and PV generation. Fortunately, commercial loads peak in the early afternoon, so the total PV generation in a utility system can reduce the peak system load, even though it may have no impact on the peak load at the residence where the PV is installed.
Figure (33): Power flows required to match PV energy generation with load energy consumption.
As part of this work, an extensive literature search was conducted to assess the current body of knowledge of expected problems associated with high penetration levels of grid-tied PV. The results of that literature survey are presented here.
Several studies have been conducted to examine the possible impacts of high levels of utility penetration of this type of PV system. One of the first issues studied was the impact on power system operation of PV system output fluctuations caused by cloud transients. A 1985 study in Arizona examined cloud transient effects if the PV were deployed as a central-station plant and found that the maximum tolerable system-level penetration level of PV was approximately 5%. The limit was imposed by the transient following capabilities (ramp rates) of the conventional generators. Another paper published in that same year [63] about the operating experience of the Southern California Edison central station PV plant at Hesperia, California, reported no such problems, but suggests that this plant had a very stiff connection to the grid and represented a very low PV penetration level at its point of interconnection.
In 1989, a paper describing a study on harmonics at the Gardner, Massachusetts, PV project was released [64]. The 56 kilowatts (kW) of PV at Gardner represented a PV penetration level of 37%, and the inverters (APCC Sun Shines) were among the first generation of true sine wave pulse width modulation inverters. All the PV homes were placed on the end of a single phase of a 13.8 kV feeder. This was done intentionally:
Selection of the houses comprising the Gardner Model PV Community was predicated on establishing a high saturation of inverters as may become typical on New England distribution feeders in the next century.
The impact of high penetrations of PV on grid frequency regulation appeared in a 1996 paper from Japan [65]. This study used modeled PV systems that respond to synthetically generated short-term irradiance transients caused by clouds. The study looked at system frequency regulation and the break even cost, which accounts for fuel savings when PV is substituted for peaking or base load generation and PV cost. This paper reaches three interesting conclusions: (1) the break-even cost of PV is unacceptably high unless PV penetration reaches 10% or so; (2) the thermal generation capacity used for frequency control increases more rapidly than first thought; and (3) a 2.5% increase in frequency control capacity over the no-PV case is required when PV penetration reaches 10%. For PV penetration of 30%, the authors found that a 10% increase in frequency regulation capacity was required, and that the cost of doing this exceeds any benefit. Based on these two competing considerations, the authors conclude that the upper limit on PV penetration is 10%.
Between 1996 and 2002, a series of reports was produced by an International Energy Agency working group on Task V of the Photovoltaic Power Systems Implementing Agreement. Unintentional islanding, capacity value, certification requirements, and demonstration project results were all the subjects of reports, but the one that is of primary importance here dealt with voltage rise. This report focused on three configurations of high-penetration PV in the low-voltage distribution network (all PV on one feeder, PV distributed among all feeders on a medium-voltage/low-voltage (MV/LV) transformer, and PV on all MV/LV transformers on an MV ring). This study concludes that the maximum PV penetration will be equal to whatever the minimum load is on that specific feeder. That minimum load was assumed to be 25% of the maximum load on the feeder in [66], and if the PV penetration were 25% of the maximum load, only insignificant over voltages occurred. Any higher PV penetration level increased the over voltages at minimum loading conditions to an unacceptable level. This study assumed that the MV/LV transformers do not have automatic tap changers (they are assumed to have manually set taps). [66]
Grid-Connected with Storage:
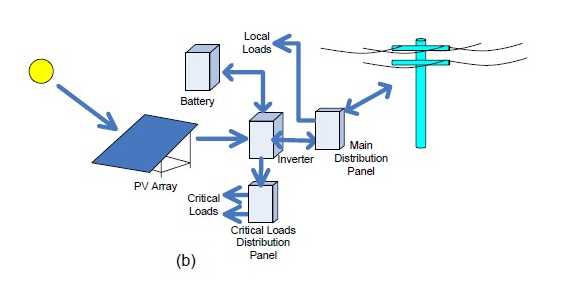
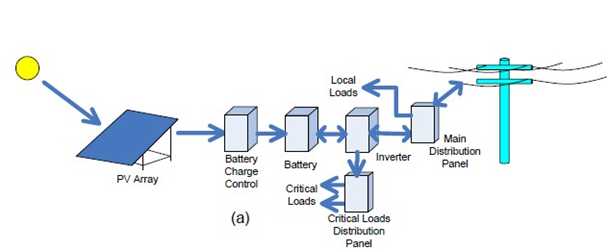
Figure 2-4 shows two basic storage architectures commonly found with grid-connected PV systems. (a) Shows an architecture that many older systems have used, where a separate battery charge control device controls power collected from the PV array. This arrangement leaves the inverter to provide backup battery charge control from the utility power grid when insufficient PV power is available, but does not allow efficient extraction of excess PV power for supply to the grid when the batteries are fully Figure 2-4charged. Figure 2-4(b) shows an architecture that is more common in modern grid-connected PV power systems that allows the PV array power to be directed optimally by the inverter to batteries or the utility power grid as appropriate.
Figure (34): Grid-connected PV systems with storage using (a) separate PV charge control and inverter charge control, and (b) integrated charge control.
In both cases, storage provides the opportunity to supply power to critical loads during a utility outage. This feature is not available without storage.
As with the grid-connected only configuration described previously, PV generation reduces the power taken from the utility power grid, and may in fact provide a net flow of power into the utility power grid if the interconnection rules permit. Storage has been traditionally deployed for the critical load benefit of the utility customer in the United States, but the Ota City High Penetration PV project [67] deployed local storage as an alternate destination for energy collected during low load periods to prevent voltage rise from reverse power flow in the distribution system.
Off-Grid with Storage:
Off-grid PV systems may include electricity or other storage (such as water in tanks), and other generation sources to form a hybrid system. Figure 2-5 shows the major components of an off-grid PV system with electricity storage, no additional generators, and AC loads. In a system of this type, correctly sizing the energy storage capacity is a critical factor in ensuring a low loss-of-load probability [68].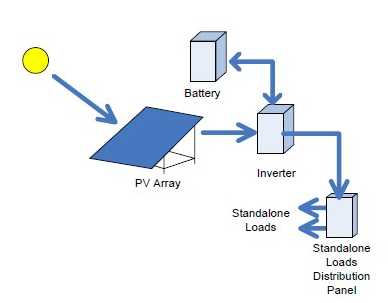
Figure (35) : Off-grid PV system with storage
In this system configuration, the inverter acts as a voltage source, which is in contrast to the grid-tied system. The stand-alone inverter determines the voltage wave shape, amplitude, and frequency. To maintain the voltage, the inverter must supply current surges, such as those demanded by motors upon startup, and whatever reactive power is demanded by the loads.
Many stand-alone PV systems include engine-generator sets. In most cases, the generators are thought of as backup generators that are operated only during periods of low sunlight or excessive load that deplete the energy storage to some minimum allowed state of charge. The inverter senses a low battery voltage condition and then starts the generator. The generator usually produces 60-hertz (Hz) AC power directly, and thus when it starts, it powers the loads directly (the power to the loads does not pass through the inverter). The inverter operates as a rectifier and battery charger, drawing generator power to recharge the batteries. The system continues in this mode until the batteries are recharged. The generator is then stopped, and the inverter resumes regulation of the AC bus voltage, drawing power from the PV and batteries.
Energy Payback System for PV:
Producing electricity with photovoltaic’s (PV) emits no pollution, produces no greenhouse gases, and uses no finite fossil-fuel resources. The environmental benefits of PV are great. But just as we say that it takes money to make money, it also takes energy to save energy. The term “energy payback” captures this idea. How long does a PV system have to operate to recover the energy—and associated generation of pollutions and CO2—that went into making the system, in the first place?
Energy payback estimates for both rooftop and ground-mounted PV systems are roughly the same, depending on the technology and type of framing used. Paybacks for multicrystalline modules are 4 years for systems using recent technology and 2 years for anticipated technology. For thin-film modules, paybacks are 3 years using recent technology, and just 1 year for anticipated thin-film technology (see Figure 1). With assumed life expectancies of 30 years, and taking into account the fossil-fuel-based energy used in manufacture, 87% to 97% of the energy that PV systems generate won’t be plagued by pollution, greenhouse gases, and depletion of resources
Based on models and real data, the idea that PV cannot pay back its energy investment is simply a myth. Indeed, researchers Dones and Frischknecht found that PV-systems fabrication and fossil-fuel energy production have similar energy payback periods (including costs for mining, transportation, refining, and construction. [69]
Energetic Performance of PV System:
Yield Calculation and Monitoring
Yield and Losses
A grid-connected PV system consists mainly of a PV array and an inverter. In order to evaluate the energetic performance of such a system, the energy yield and losses at the different conversion performance of such a system, the energy yield and losses at the different conversion steps are normalized to the power values under STC. The method and nomenclature as it is introduced here is common practice in PV system engineering [70, 71]. Yield and losses can be allocated to the different components of a grid-connected PV system as shown in the figure ( ).
The reference yield is defined as solar irradiation on the tilted plane normalized to the solar irradiance under STC, hence,
It is expressed in hours or “kWh / kWp”.
Array yield and final yield Yf are calculated by normalizing the energy before, respectively, after passing the inverter, to the rated power of the Pv array under STC.
In practice, these values are mostly given in “ kWh / kWp ”. Accordingly, the capture loses and system losses are calculated as
The term system losses may be misleading. It originates from Stand-alone and hybrid PV systems and includes all losses that are not capture losses. For a grid-connected PV installation, the system losses are mainly inverter losses.
Yield and losses as defined above are usually calculated either as annual values or as daily mean values during a specified period such as a day, month or year. Nevertheless, analogues figure can be calculated based on instantaneous irradiance and
Figure (36): Energy flow in a grid-connected PV system.
Power instead of irradiation and energy in the literature it has been proposed the same nomenclature but with lower case letters for analysis of the power flow in PV system [71].
In order to Assess and compare the performance of PV system over several years and for different sites, independently of variations of the solar recourses, array yield and final yield are normalized to the reference yield. The performance ratio is defined as
It can be interpreted as the ratio between the actual system yield and the yield of an ideal system, always operating with the conversion efficiency of the PV array under STC.
A performance database of PV systems Worldwide is maintained within the International Energy Agency’s Photovoltaic Power System Programme (IEA PVPS).While PV system installed in Germany before 1995 exhibits performance ratio is 0.74[70]. The development can be explained by learning effects in PV system engineering during the national 1000-Roof-PV-Programme, running from 1991 to 1994 [71]. The mean performance ratio of PV system in Japan installed in the 1990s is situated around 0.73 and it is not much varying over the years [76]. In the Belgian project for PV at schools, the mean performance ratio of all system in 1990 was 0.70 [77].
Common to all monitoring programmers was a very high spread of the Annual performance ratio among the installation. The IEA PVPS conclude on this basis that via further optimization “average annual PR values of higher than 0.75 are to be achieved for well-planned PV system.”[70]
By assuming a realistic performance ratio, the Annual final yield for a given site can be estimated based on long-term mean values of solar irradiation. Table 2 shows irradiation and expectably yield values for different sites in Belgium.
A low performance ratio can be either due to shadowing of the PV array or to flaws in the system design. Typical causes for a bad performances are inverter failure, a low inverter efficiency, increase arrays temperature due to bad ventilation of the arrays back side or exaggerated module reduction in yield is tolerated many cases. Nevertheless, addition electrical losses can occur as a consequence of PV module and string mismatch with partial shadowing. Yet, these losses can be minimized already in the planning phase, if the array arrangement is Adapted to the particular shadowing situation
Monitoring:
The monitoring of photovoltaic system in Europe should follow IEC 61724 [79] and the guidelines of the European Commission [70]. These guidelines are meant to define “a minimum set of quantities as well as standards recording techniques” [70]. Additional requirements may be specified as, for example, in Dutch guideline for PV monitoring system
The guideline of the European Commission distinguish between “analytical monitoring” and “Global monitoring”[70]. For global monitoring, the integral values of reference yield, array yield and final yield are manually recorded for periods of one month of shorter, Global monitoring is usually applied in order to verify the trouble free operation of a PV system based on the energy balance. Conversely, analytical monitoring is necessary in order to study the system performance in detail. Analytical monitoring is necessary in order to draw. Conclusions regarding yield reductions and the potential for future improvements.
Analytical monitoring includes the measurement of the system voltage, the current, and the power on the DC and AC side of the inverter. Moreover, the measurement of the ambient temperature is required. Although not required in [69], often in the individual string current are measured and the PV cell temperature via the modules back side. The precision of the Data should be within 2% of full scale, that is, class 2. According to[70] the data must be recorded as hourly averages, sampled at one value per minute at least. In the Dutch guidelines [, ten minute average are required, sampled at one per second. In the recent Japanese monitoring programme even one –minute averages are recorded.

