Tree effect
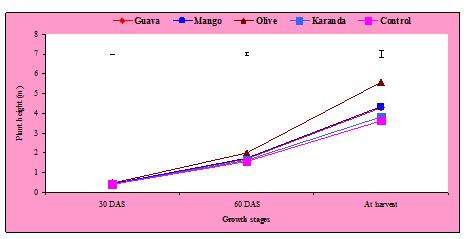
In cucumber, plant height at different days after sowing (DAS) was affected significantly due to cultivation under different tree species. The highest (0.46 m) plant light of cucumber at 30 DAS was observed under O. europea species and the lowest (0.39 m) was recorded under control treatment which was followed by C. acuminata (0.39 m). At 60 DAS, significantly the highest (1.98 m) plant height of cucumber was observed under O. europea species and the lowest (1.57 m) was recorded under control treatment. Plant height of cucumber was statistically similar to that of C. acuminata (1.63 m), M. indica (1.74 m) and P. guajava (1.68 m) species. Similar pattern of plant height was observed at harvest time. In this case, the highest (5.59 m) plant height was observed under O. europea species and the lowest was observed under control treatment (3.63 m). Under reduced sunlight, the higher length of cucumber is the contribution of higher stem length and internodes length. This was probably due to higher apical dominance under shade condition ( Hillman, 1984).
Distance effect
At 30 days after sowing (DAS), plant height of cucumber was not significantly affected by different distances (Fig. 19.2). But at 60 DAS and at harvest, plant height was significantly affected by distances. Significantly, the highest (1.79 m) plant height at 60 DAS was recorded at D1 distance and the lowest (1.65 m) was recorded at D2 distance. At harvest time the highest (4.52 m) plant height was observed at D1 and the lowest was recorded at D2 (4.15 m) distance.
Cucumber grown at closer distance from tree base experienced deep shade and high moisture level which influenced its apical dominance and thus this plant was taller than those grown to apart from tree base.
Combined effect between associated tree species and distance from tree base.
Plant height of cucumber at different days after sowing (DAT) was significantly influenced by the tree species and distance from tree base (Table 7). Significantly the highest (0.50 m) plant height was recorded at D1 distance which was followed by D2 (0.49 m) distance under O. europea species. The lowest (0.37 m) plant height was recorded at D2 distance which was statistically similar to D1 (0.39 m) distance under control treatment and D2 (0.38 m) distance under C. acuminata species. At 60 DAS, the highest (2.13 m) plant height of cucumber was observed at D1 distance under O. europea species and the lowest (1.45 m) was recorded at D1 distance under control treatment.
Similarly at harvest, the highest (5.23 m) plant height of cucumber was recorded at D1 distance under O. europea species and the lowest (3.58 m) was recorded at D1 distance under control treatment.
Table 7: Combined effect between associated tree species and distance from tree base on plant height of cucumber
| Tree species | Distance from tree base (m) | Plant Height (m) | ||
30 DAT | 60 DAT | At harvest | ||
| P. guajava | D1(0.5) | 0.40 d | 1.59 d | 4.26 c |
D2(2.0) | 0.44 b | 1.68 cd | 4.29 c | |
| M. indica | D1(0.5) | 0.45 b | 1.68 cd | 4.26 c |
D2(2.0) | 0.42 c | 1.80 bc | 4.44 c | |
| O. europea | D1(0.5) | 0.50 a | 1.83 b | 4.80 b |
D2(2.0) | 0.49 a | 2.13 a | 5.38 a | |
| C. acuminata | D1(0.5) | 0.38 de | 1.70 b-d | 3.90 d |
D2(2.0) | 0.39 de | 1.65 cd | 3.73 d | |
| Control | D1(0.5) | 0.37 e | 1.45 e | 3.58 d |
D2(2.0) | 0.41 cd | 1.69 b-d | 3.68 d | |
| CV (%) | – | 3.14 | 4.44 | 4.42 |
| LSD | – | 2.31 | 0.13 | 0.33 |
Plant duration
Tree effect
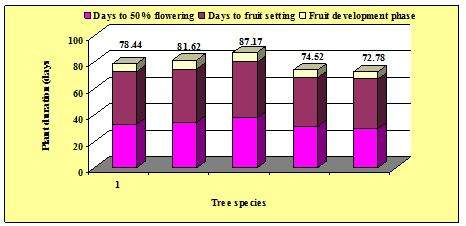
Plant duration of cucumber was significantly affected by associated tree species (Fig. 20.1). The highest (37.83 days) duration of days to 50 % flowering was recorded under O. europea species and the lowest (29.50 days) was observed under control treatment which was statistically similar to that of C. acuminata (31.17 days) and P. guajava (32.83 days). The highest (42.17 days) days to fruit setting was recorded under O. europea tree and the lowest (37.50 days) was observed under control treatment. Similarly fruit development period was significantly affected by different tree associations. Fruit development period was the shortest (5.78 days) under control treatment which was statistically identical to C. acuminata (6.06 days) and P. guajava (6.11 days) species and the longest duration was observed under O. europea species ( 7.22 days) followed by M. indica ( 6.78 days).
Total crop duration increased significantly with reducing light intensity; i.e under different tree species. The longest (87.17 days) crop duration was recorded under O. europea species while the shortest (72.78 days) crop duration was observed under full sunlight (control). There was no significant variation of crop duration under P. guajava (78.44 days) and M. indica (81.62 days) species.
Deep shade with dense canopy was observed in O. europea species (3.48 m2) when cucumber was cultivated under it. Its canopy to the upper level was fully covered which usually permitted little sunlight to the ground. P. guajava was 4.53 m2 canopy spread but its canopy was spreading and shade was light which usually permitted to penetrate light to the ground. M. indica species was also deep company (3.58 m2), but the canopy to the upper ground was not fully covered and light was used to reach to the ground between the rows of M. indica. On the other hand, C. acuminata was a shrub and its canopy (1.70 m2) was short which usually permitted sufficient sunlight as like control to the ground level. AS a result, the shade level of these trees were O. europea> M. indica> P. guajava> C. acuminata. Flowering, fruit setting, fruit development and total crop duration of cucumber was fully exposed to shade-light effect. Budge et al., (1987) reported that shading somewhat delayed vegetative and reproductive period of cucumber. The longer duration of individual fruit under reduced sunlight, contributed to the longer crop duration by enhancing the post- an thesis growth phase. This was clearly visible under different tree species under the experiment.
Distance effect
Cucumber grown as a function of distance from tree base also affect the plant duration (Fig. 20.2). Sometimes the effect was not statistically significant. There was no significant variation of days to 50% flowing at D1 (33.73 days) and D2 (33.07 days) distances respectively. Days to fruit setting were significantly influenced by the distances. The highest (41.80 days) days to fruit setting was recorded at D1 distance while the lowest (39.20 days) was observed at D2 distances. Fruit development period of cucumber was not significantly influenced by distance from tree base while total crop duration was significantly affected. The highest (82.13 days) total crop duration of cucumber was recorded at D1 and the lowest (78.45 days) was observed at D2 distance.
Cucumber grown at closer distance from tree base experienced moisture and nutrient competition and the canopy of tree created shade which persists all day long. So, the shortage of light under tree increase self-life of cucumber as compared to grow it away from tree base, Moreover, shade increased the chlorophyll content of cucumber which increased its photosynthesis capacity.
Combined effect between associated tree species and distance from tree base on plant duration of cucumber
Plant duration of cucumber was significantly affected by combined effect of associated tree species and distance from tree base (Table 8). Significantly the highest (38.33 days) days to 50 % flowering was recorded at D1 distance under O. europea species and the second highest days was observed under M. indica based agroforestry system which was statistically similar to P. guajava at the same distance. The lowest (29.33 days) days to 50% flowering was recorded at D2 distance followed by D1 (29.67 day) distance. The highest (46.66 days) days to fruit setting was observed at D1 distance under O. europea species and the lowest (36.67 days) was recorded at D2 distance under control treatment.
In case of fruit development period and total crop duration, similar trend was recorded. Fruit development period and total crop duration was the highest (7.44 and 92.43 days respectively) at D1 distance under O. europea species and the lowest (5.67 and 71.78 days respectively) was observed at D1 distance under control treatment.
At closer distance under O. europea species, cucumber got deep shade as compared to longer distance. As a result the photosynthetic organs of cucumber produced large amount of chlorophyll which increase its self life and post anthesis growth phase. Similar funding was reposted by Budge et al., (1987).
Table 8: Combined effect of associated tree species X distance from tree base on plant duration of cucumber
Tree species | Distance from tree base (m) | Days to 50% flowering | Days to fruit setting | Fruit development period (Days) | Total crop duration (days) |
P. guajava | D1(0.5) | 33.67 bc | 39.00 e | 6.44 bc | 79.11 d |
D2(2.0) | 32.00 cd | 39.33 de | 6.56 b | 77.89 d | |
M. indica | D1(0.5) | 35.00 b | 41.33 c | 6.56 b | 82.89 c |
D2(2.0) | 34.33 b | 40.33 cd | 7.11 ab | 81.77 c | |
O. europea | D1(0.5) | 38.33 a | 46.66 a | 7.44 a | 92.43 a |
D2(2.0) | 35.33 b | 44.67 b | 7.00 ab | 87.00 b | |
C. acuminata | D1(0.5) | 32.00 cd | 37.33 fg | 5.78 cd | 75.11 de |
D2(2.0) | 30.33 de | 36.33 g | 5.56 d | 72.22 de | |
Control | D1(0.5) | 29.67 e | 38.33 ef | 5.67 d | 71.78 e |
D2(2.0) | 29.33 e | 36.67 g | 5.78 d | 73.67 f | |
| CV (%) | – | 3.68 | 1.82 | 5.85 | 1.09 |
| LSD | – | 2.11 | 1.27 | 0.64 | 1.49 |
SPAD value (Soil plant Analysis Development)
Tree effect
SPAD reading determines the greenness or relative chlorophyll content of leaves (Inada, 1963). There is a strong linear relationship between SPAD value and leaf nitrogen content, i.e., increasing leaf nitrogen increases the SPAD value. Significantly the lowest SPAD value (33.77) was recorded under control treatment (Full sun light) which was followed by C. acuminata (35.50), M. indica (35.25) and P. guajava (35.67) based agroforestry systems at 30 day after sowing (DAS) of cucumber. At 30 day after sowing of cucumber, the highest SPAD value (43.95) was recorded under O. europea species. Similar trend was observed at 60 DAS and at harvest time. At 60 day after sowing, the highest SPAD value (45.58) was recorded under O. europea species and the lowest (36.00) was recorded under control treatment. SPAD value at harvest time of cucumber was the highest (39.97) under O. europea species and the lowest (31.65) was under control treatment (Fig. 21.1).
Cucumber grown under P. guajava, M. indica, O. europea and C. acuminata based agroforestry systems experienced different amount of shading. Shade was the highest under O. europea species which was followed by M. indica, P. guajava and C. acuminata. C. acuminata species is bushy and its canopy spread was lowest (1.70 m2) which reflect a little light. So, the crop performance under this tree was equivalent to control treatment. The lower light intensity due to shading by O. europea, M. indica and P. guajava caused an increase in synthesis and accumulation of chlorophyll that’s the causes of increased SPAD value under shade (Chen et al., 1994). The efficiency of photosynthesis was maintained through absorption of more light by the accessory pigments and by increasing chlorophyll content (Helton, 1983)
Distance effect
Distance did not affect the SPAD reading observed at 30 DAS, 60 DAS and at harvest time (Fig. 21.2). However, the highest (38.35) SPAD value was recorded at D1 distance at 30 DAS and the lowest (35.31) was recorded at D2 distance under the same distance. While the highest SPAD value at 60 DAS (41.49) and at harvest (35.77) time were recorded at D1 Distance and the lowest was recorded at D2 distance. When days after sowing (DAS) were observed, SPAD reading gradually increased and at harvest time, it was decreased.
Combined effect between associated tree species and distance from tree base
SPAD value was significantly affected by the combined effect of tree species and distance from tree base (Table 9). As shading increased the SPAD value, the highest (44.77) SPAD value was recorded at D1 distance under O. europea species and the lowest (34.10) was recorded at D2 distance under control treatment. At 60 DAS, the highest (42.77) SPAD value was recorded at D1 distance under O. europea species and the lowest (36.87) SPAD value was recorded at D2 distance under control treatment. Similar trend of SPAD value was observed at harvest time of cucumber. The highest (39.53) SPAD reading was observed at D1 distance and the lowest (31.43) was recorded at D2 distance under control treatment
When distances from tree base increase, shade deceased simultaneously and the light intensity increased. The increased light intensity decrease the chlorophyll content as chlorophyll takes part into photosynthesis activities and thus increased light intensity decreased the SPAD value.
Table 9. Combined effect of associated tree species and distance from tree base on SPAD value in cucumber field
| Tree species | Distance from tree base (m) | SPAD value (30 DAS) | SPAD value (60 DAS) | SPAD value (at harvest) |
P. guajava | D1(0.5) | 36.87 bc | 38.63 d | 35.53 bc |
D2(2.0) | 34.47 c | 39.03 d | 34.63 b-d | |
M. indica | D1(0.5) | 36.10 c | 49.53 a | 34.77 b-d |
D2(2.0) | 34.40 c | 41.63 bc | 32.53 de | |
O. europea | D1(0.5) | 47.77 a | 42.77 b | 43.53 a |
D2(2.0) | 40.13 b | 41.73 bc | 36.40 b | |
C. acuminata | D1(0.5) | 34.10 c | 37.13 de | 31.63 e |
D2(2.0) | 33.43 c | 34.87 e | 31.67 e | |
Control | D1(0.5) | 36.90 bc | 39.37 cd | 33.40 c-e |
D2(2.0) | 34.10 c | 38.60 d | 31.43 e | |
| CV (%) | – | 5.13 | 3.49 | 4.15 |
| LSD | – | 3.24 | 2.42 | 2.46 |
Internode length
Tree effect
Internode length of cucumber was significantly influenced by different tree species (Figure 4.1). The longest internode length (8.65 cm) was recorded under O. europea species and the shortest was recorded under control treatment (7.15 cm). This was probably due to higher apical dominate under shade condition. Similar result was found by Hillman (1984) and Haque (2001) in cucumber.
Distance effect
There was no significant variation was recorded when cucumber grown as a function of distance from tree base (Fig 4.2). The highest (8.05 cm) internode length was recorded at D1 distance and the lowest (7.86 cm) was recorded at D2 distance.
Stem diameter
Tree effect
In cucumber, the stem diameter was increased significantly under different tree species as compared to control treatment. The highest (3.82 cm) stem diameter was observed under control treatment and the lowest (2.85 mm) was recorded under O. europea species. Shade exhibited the apical dominance which increased the length as compared to diameter. So, under shade, stem diameter was reduced. Similar reduction of stem diameter with decreasing light was also reported by Tazel and Gul (1994). Corre (1983) reported that stem length increased at the expense of root growth and stem girth.
Distance effect
Stem diameter of cucumber was significantly influenced by the effect of distance from tree base. The highest (3.36 mm) stem diameter was recorded at D2 distance and the lowest (3.02 mm) was recorded at D1 distance.
Fruit number per plant
Tree effect
Number of fruits per plant is the dominant yield contributing characteristics, which was significantly influenced by different tree species (Fig. 24.1). The maximum number of fruits per plant (8.94 fruits/plant) was recorded under control treatment and the minimum number of fruits (6.50 fruits/plant) per plant was observed under O. europea species followed by M. indica (6.94 fruits/plant), P. guajava (6.72 fruits/plant) and C. acuminata (7.33 fruits/plant) based systems. Shade and lower node number suggest less number of total flowers under different tree species. So, higher number of female flower under full sunlight could be possible reason for obtaining higher number of fruits. Similar influencing pattern in number of fruits per plant was found in bottle gourd under reduced light levels (Miah, 2000).
Distance effect
Number of fruits per plant was not significantly influenced by the effect of distance from tree base. The minimum (7.28 fruits/plant) fruits per plant were observed at D1 distance and the highest (8.48 fruits/plant) fruits per plant were recorded at D2 distance .
Fruit length
Tree effect
Upperstorey tree canopy and agroforestry systems had significant influence on the fruit length of cucumber. The control treatment produced the longest (22.61 cm) cucumber and the shortest (15.48 cm) cucumber was obtained under deep shady O. europea species .
Distance effect
Distance had no significant effect on fruit length of cucumber. The longest (19.60 cm) cucumber fruit was obtained at D2 distance while the D1 distance produced the shortest (18.46 cm) cucumber fruit
Combined effect between associated tree species and distance from tree base on yield contributing characteristics of cucumber
Internode length of cucumber plant was significantly influenced by the combined effect of tree species and distance from tree base (Table 10). Significantly the highest (9.16 cm) internode length of cucumber plant was recorded at D1 distance under O. europea based agroforestry system and the lowest (7.03 cm) internode length was observed at D2 distance under control treatment.
In case of stem diameter of cucumber plant, the highest value (9.15 mm) was obtained at D2 distance under control treatment and the lowest (7.03 mm) was recorded at D1 distance under O. europea species. Fruits number per plant was also followed the same trend as like stem diameter of cucumber. The maximum (13.77 fruits/plant) fruits per plant was recorded at D2 distance under control treatment and the minimum (6.22 fruits/plant) was recorded at D1 distance under O. europea based agroforestry system. Similarly, the highest (24.63 cm) cucumber fruit length was observed at D2 distance under control treatment and the lowest (14.96 cm) fruit length was recorded at D1 distance under O. europea species.
Table 10: Combined effect between associated tree species and distance from tree base on yield contributing characteristics of cucumber
| Tree species | Distance from tree base (m) | Internode length (cm) | Stem diameter (mm) | Fruit number plant-1 | Fruit length (cm) |
P. guajava | D1(0.5) | 8.27 b | 7.98 bc | 7.00 c | 16.00 ef |
D2(2.0) | 7.98 bc | 8.27 b | 7.11 c | 17.30 de | |
M. indica | D1(0.5) | 7.98 bc | 7.78 c | 6.44 c | 17.26 de |
D2(2.0) | 7.78 c | 7.98 bc | 6.77 c | 17.58 de | |
O. europea | D1(0.5) | 9.16 a | 7.03 d | 6.22 c | 14.96 f |
D2(2.0) | 8.13 bc | 7.27 d | 6.55 c | 16.90 d-f | |
C. acuminata | D1(0.5) | 8.07 bc | 7.88 bc | 7.33 c | 20.14 bc |
D2(2.0) | 7.88 bc | 8.07 bc | 7.55 c | 18.90 cd | |
Control | D1(0.5) | 7.27 d | 8.13 bc | 10.11 b | 21.58 b |
D2(2.0) | 7.03 d | 9.15 a | 13.77 a | 24.63 a | |
| CV (%) | – | 2.97 | 8.27 | 9.19 | 5.67 |
| LSD | – | 0.41 | 0.98 | 1.24 | 1.85 |
Fruit diameter
Tree effect
Fruit diameter of cucumber showed decreasing trend under different tree species and the variation was significant. The highest (54.29 mm) fruit diameter of cucumber was recorded under control treatment and the lowest (43.87 mm) one was observed under O. europea based agroforestry system (Fig 26.1).
Distance effect
Distance from tree base had significant effect on fruit diameter of cucumber. Significantly the highest (50.61 mm) fruit diameter was recorded at D2 distance and the lowest (47.56 mm) was observed at D1 distance (Fig 26.2).
Single fruit weight
Tree effect
Single fruit weight was significantly affected by different tree species (Fig 27.1). The heaviest (229.50 g) single fruit weight was recorded under control treatment followed by P. guajava (221.50 g) species. However single fruit weight reduced markedly when light availability was further reduced. The lightest (145.80 g) cucumber fruit was observed under O. europea based agroforestry system.
Distance effect
Single fruit weight of cucumber was also significantly influenced by the distance from tree base. The heaviest (202.30 g) single fruit of cucumber was observed at D2 distance and the lightest (184.5 g) was recorded at D1 distance (Fig 27.2).
Yield (t/ha)
Significant variation in yield of cucumber was resulted due to shade effect of different tree species (P. guajava, M. indica, O. europea andC. acuminata). Cucumber grown under P. guajava, M. indica, O. europea and C. acuminata based agroforestry systems received less sunlight by 646.75, 666.54, 563.00 and 919.89 µmm-2S-1, respectively compared to solely grown cucumber plant (1130.27 µmm-2s-1) resulting decrease yield under trees (Fig. 28.1). The combined effect of yield contributing characters finally decreased the cucumber yield. Significantly the highest (11.67 t/ha) yield of cucumber was recorded under control treatment followed by C. acuminata (9.55 t/ha) and the lowest (6.94 t/ha) yield was observed under O. europea tree based agroforestry system. Similar trend of cucumber yield decline under shaded condition was also reported by Haque (2001). Diffuse light promotes the development of vegetative structures while intense light favors the development of flowers, fruits and seeds. (Weaver and Clements, 1973). Light intensity also influences the translocation of carbohydrate in plant. Under reduced light conditions, translocation of the carbohydrates from source to sink is poor which reduced yield significantly ( Murty and Murty, 1981).
Distance effect
Distance from tree base had significant influence on yield of cucumber (Fig 28.2). The highest (9.80 t/ha) yield of cucumber was recorded at D2 distance while the lowest (8.73 t/ha) was observed at D1 distance.
Combined effect between associated tree species and distance from tree base on fruit
diameter, single fruit weight and yield of cucumber
Fruit diameter of cucumber was significantly influenced by the combined effect of tree species and distance from tree base (Table 11). The statistical result indicated a decreasing trend in fruit diameter with increase of shade level/canopy spread. The highest (58.32 mm) fruit diameter of cucumber was recorded at D2 distance under control treatment. On the other hand D1 distance of O. europea based agroforestry system produced the lowest (40.76 mm) diameter of cucumber fruit.
Combined effect of associated tree species and distance from tree base on the single fruit weight was highly significant (See Table 6). The highest (241.9 g) single fruit weight of cucumber was recorded at D2 distance under control treatment while the lowest (142.6 g) was observed at D1 distance under O. europea based agroforestry system. Combined effect of associated tree species and distance from tree base on the yield per hectare was also highly significant. Per hectare yield was decreased under comparatively heavy shade and increase with the increasing of distance from tree base. Control treatment produced the highest yield (11.48 t/ha) at D2 distance while the lowest (7.88 t/ha) was obtained at closer distance (D1) under O. europea based agroforestry system.
Table 11: Combined effect between associated tree species and distance from tree base on fruit diameter, single fruit weight and yield of cucumber
| Tree species | Distance from tree base (m) | Fruit diameter (mm) | Single fruit weight (g) | Yield (tha-1) |
P. guajava | D1(0.5) | 46.68 de | 219.2 b | 8.73 cd |
D2(2.0) | 46.98 de | 224.5 b | 9.44 bc | |
M. indica | D1(0.5) | 45.88 e | 179.9 c | 7.187 e |
D2(2.0) | 46.60 de | 158.8 d | 8.07 d | |
O. europea | D1(0.5) | 40.76 f | 142.6 e | 7.88 d |
D2(2.0) | 44.31 e | 149.0 de | 8.11 d | |
C. acuminata | D1(0.5) | 49.19 cd | 223.9 b | 9.21 ab |
D2(2.0) | 49.87 c | 176.9 c | 9.04 ab | |
Control | D1(0.5) | 53.27 b | 217.1 b | 11.42 a |
D2(2.0) | 58.32 a | 241.9 a | 11.48 a | |
| CV (%) | – | 3.22 | 3.71 | 4.68 |
| LSD | – | 2.71 | 12.29 | 0.88 |
Light intensity
Tree effect
The relationship between day after measurement and average light intensity (µmm-2s-1) was studied in the field of cucumber intercropped with different tree species and in some cases significant effect of light intensity and day after measurement was observed
No Significant variation of light intensity was observed with the increase of day after measurement from the initial stage of seed sowing to the final harvesting stage, i.e., the whole cropping season. The light intensity was more or less same. Because of cucumber was cultivated at Kharif 1 season which starts from March to May and in this season the light intensity was not changed at all (Fig. 1).
Considering the tree species, the minimum light intensity was observed under O. europea based agroforestry system throughout the growing season as its canopy was dense (3.35 m2) and the efficiency of light passing through its canopy was lowest (563 µmm-2s-1) as compared to P. guajava (646.45 µmm-2s-1), M. indica (666.54 µmm-2s-1) and C. acuminata (919.89 µmm-2s-1) species. On the other hand the maximum light intensity was observed under control treatment (1140.24 µmm-2s-1). As a result, the trend of light intensity throughout the cucumber growing season for different treatments was control > C. acuminata > P. guajava >M. indica > O. europea.
Distance effect
Light intensity under different tree species was significantly influenced by distance from tree base (Fig 11.2). The highest light intensity (849.20 µmm-2s-1) was recorded at D2 distance and the lowest (735.3 µmm-2s-1) was observed at D1 distance (Fig. 29.2).
Tree effect
A strong relation between days after measurement and soil moisture (%) was observed in the field of cucumber intercropped with different tree species (Fig. 30.1). The slight variation of soil moisture was observed with increase of day after measurement. At the initial stage of cucumber growing season, soil moisture was higher for all the tree species; those were gradually decreased with increasing day after measurement. Cucumber cultivation started at 15 th march and its life cycle completed at May in the season of Kharif 1. During this crop growing season, a little amount of rain fall occurs, which did not affect the soil moisture. As a result as the Kharif 1 season ahead, soil moisture decreased gradually.
Considering the tree species, the minimum soil moisture was observed under C. acuminata species, because of its root system was shallow and spreading in nature which uptake more moisture as compared to deep rooted tree species (P. guajava, M. indica and O. europea). On the other hand the maximum soil moisture was recorded under O. europea species throughout the growing season. The dense canopy and deciduous nature of O. europea species continuously fall litter under tree which decompose and retained a huge amount of moisture. This was followed by P. guajava, M. indica and control. So, soil moisture throughout the growing season for different tree species were O. europea >P. guajava > M. indica> control> C. acuminata.
Distance effect
Distance from tree base had significant influence on soil moisture intercropped with different tree species. Continuous litterfall increase the soil microbial activities which decompose the litters, increases the soil organic matter and increase the soil moisture beneath the tree. The highest soil moisture (19.4%) was recorded at D1 distance while the lowest (16.41 %) was recorded at D2 distance .
Tree effect
The relationship between days after measurement and soil temperature was studied in the field of cucumber intercropped with different tree species (Fig. 31.1). The significant effect of soil temperature and day after measurement was observed as a function of associated tree species.
The increasing trend of soil temperature was observed with the increase of day after measurement. At the initial stage of cucumber cultivation, temperature was lower which increased gradually up to the final stage of cropping season. However, at the initial stage of Kharif 1 season (March), a little rainfall was occur which increased a little soil moisture, simultaneously decreased the soil temperature. As cropping season forward, soil moisture continuously deceasing which increase soil temperature due to higher evaporative water losses as a function of higher soil temperature.
Considering the tree species, the minimum soil temperature was recorded under O. europea based agroforestry system throughout the growing season. On the other hand, the maximum soil temperature was observed under control treatment followed by C. acuminata, P. guajava and M. indica based system. As a result, the trend of soil temperature throughout the cucumber growing season for different tree species was control > C. acuminata > P. guajava> M. indica> O. europea.
Distance effect
Soil temperature in the cucumber field was significantly affected as a function of distance from tree base (Fig 31.2). Significantly the lowest soil temperature (33.96 oC) was recorded at D1 distance and the highest soil temperature (35.04 oC) was observed at D2 distance.
The presence of tree may have both positive and negative over all effects on the water budget of the soil and the crops growing in between or beneath the tree. The higher soil moisture under Erythrina sp may have been partly due to lower evaporative water losses as a function of lower soil temperature (Bronstein, 1984). So, under tree soil temperature was low and apart from the tree it was high.
Combined effect between associated tree spices and distance from tree base on microclimatic parameters of cucumber field
Significant influence on the light intensity (mm-2s-1) was observed due to combined effect of tree species and distance from tree base (Table 12).
In all agroforestry systems the lowest light intensity (546.3 mm-2s-1) was recorded at D1 distance under O. europea species and the highest (1203.00 mm-2s-1) was observed at D2 distance under no tree control. The canopy of O. europea species was dense and spreading (3.48 m2) which reduced light penetration to the soil layer resulting insufficient light under this tree. M. indica (3.58 m2) and C. acuminata (1.70 m2) had also spreading but light canopy coverage which usually allows moderate light to the ground.
Soil moisture under agroforestry system was higher as compared to control. But when distances take into consideration the highest soil moisture (21.54%) was recorded beneath the tree (D1) under O. europea based agroforestry system and apart from the tree, soil moisture was lower. Significantly the lowest soil moisture (14.86%) was recorded at D2 distance under control treatment.
Soil temperature was significantly decreased with increasing canopy coverage. The lowest soil temperature (30.89 oC) was observed at D1 distance under O. europea species and the highest (37.67 oC) was recorded under no tree control.
Table 12. Combined effect between associated tree species and distance from tree base on microclimatic parameters on cucumber field
Tree species | Distance from tree base (m) | Light intensity (μ molm-2s-1) | Soil moisture (%) | Soil temperature (0C) |
P. guajava | D1(0.5) | 528.0 h | 20.67 ab | 33.80 c |
D2(2.0) | 748.2 e | 16.22 d-f | 35.40 bc | |
M. indica | D1(0.5) | 605.0 f | 19.09 bc | 35.27 bc |
D2(2.0) | 728.1 e | 17.59 cd | 35.00 bc | |
O. europea | D1(0.5) | 546.3 gh | 21.54 a | 30.89 d |
D2(2.0) | 578.0 fg | 20.26 ab | 31.63 d | |
C. acuminata | D1(0.5) | 819.0 d | 16.96 de | 35.43 bc |
D2(2.0) | 1021.00 c | 16.36 d-f | 34.33 bc | |
Control | D1(0.5) | 1146.00 b | 15.53 ef | 35.57 b |
D2(2.0) | 1203.00 a | 14.86 f | 37.67 a | |
| CV (%) | – | 3.15 | 5.04 | 2.58 |
| LSD | – | 42.87 | 1.55 | 1.53 |
Correlation between light intensity (µmm-2s-1) and yield of cucumber
There existed a linear relationship between light intensity and yield of cucumber intercropped with different tree species (Fig. 32). When P. guajava and C. acuminata species takes into consideration, increasing light intensity gradually increased the yield of cucumber. But in case of M. indica and O. europea species, increasing light intensity suddenly increased the yield of cucumber. In other way, decreasing light intensity drastically decreased the yield of cucumber under these two trees.
In case of P. guajava, the linear relationship between light intensity and yield of cucumber estimated as Y = 0.0019 x + 10.929 (R2 = 0.6837), where R2 value was significant. This equation also stated that yield of cucumber increased at the rate, of 0.0019 t/ha for per unit changing of light intensity. C. acuminata also showed the positive and significant relationship (R2 =0.8214) and cucumber yield increased under this tree at the rate of 0.0038 t/ha for per unit changing of light intensity.
In case of M. indica, linear relationship was observed and estimated as Y = 0.0139x – 0.2538, (R2 = 0.8658), where R2 value was significant and positive. It was recorded that, under M. indica species, 0.0139 t/ha yield of cucumber was increased for per unit changing of light intensity. In the same way, O. europea showed positive and significant relationship (R2 = 0.8566) and yield of cucumber under this tree suddenly increased by 0.0346 t/ha for per unit changing of light intensity.
Correlation between soil moisture (%) and yield of cucumber
The correlation between soil moisture and yield of cucumber showed a linear relationship which was negative and significant. On the other hand, increasing soil moisture in the all agroforestry systems decreased yield of cucumber (Fig. 33).
In the P. guajava based agroforestry system, the relationship was negative and significant and estimated as Y = – 0.1034 x + 14.032 (R2 =0.6694). The R2 value indicated that, about 67 percent of the contribution to the yield of cucumber can be explained by the light treatment and 0.1034 t/ha yield of cucumber decreased by per unit changing of light intensity. There was a negative but significant relationship between soil moisture and yield of cucumber under M. indica based agroforestry system which estimated at Y = -0.5423 x + 18.015 (R2 = 0.5899) and every unit changing of light intensity, yield of cucumber was reduced by 0.5423 t/ha.
In the C. acuminata based agroforestry system, the relationship between soil moisture and yield was the same as like M. indica based system and under this field, cucumber yield was reduced by 0.3196 t/ha for per unit changing of light intensity. Same relationship was recorded under O. europea based agroforestry system and yield reduction was estimated by 0.2247 t/ha for every unit changing of light intensity.
Correlation between soil temperature (oC) and yield of cucumber
A linear relationship between soil temperature and yield of cucumber was observed under various agroforestry experiments (Fig. 34). The relation indicated that increasing soil temperature increased the yield of cucumber. The yield of cucumber was the highest under P. guajava based agroforestry system which was followed by M. indica and C. acuminata, while the lowest yield was observed under O. europea based agroforestry system whose canopy was dense and light usually retard penetration to the ground level.
The relationship between soil temperature and yield of cucumber under P. guajava based agroforestry system was positive and significant and estimated as Y = 0.1482 x + 7.3333 (R2 = 0.5649). This equation stated that yield of cucumber was minimum i.e. 11.51 t/ha at 30.73 oC soil temperature and above this limit, cucumber yield increased at the rate of 0.1482 t/ha for per unit changing of soil temperature. Cucumber cultivation under M. indica based agroforestry system showed the same trend like P. guajava and the relation between soil temperature and yield was positive and significant (R2 = 0.765) and it was noted that yield of cucumber increased by 0.7878 t/ha for per unit changing of soil temperature.
The relation between soil temperature and yield of cucumber under C. acuminata (R2 = 0.6218) and O. europea (R2 = 0.7857) based agroforestry system was also positive and significant, i.e., increasing soil temperature increased the yield of cucumber.
Correlation between canopy volume (m2) and yield of cucumber
Correlation between canopy volume of different tree species and yield of cucumber showed the negative but significant linear relationship (Fig. 35). This means that increasing canopy spread decreased the yield of cucumber. The cucumber yield decreasing trend was gradual under P. guajava and C. acuminata based agroforestry system, but it was drastic and sudden under M. indica and O. europea based agroforestry system.
Under P. guajava based agroforestry system, the relation between canopy volume and yield was negative and significant; which means that every unit increasing of canopy spread, cucumber yield decreased by 1.1666 t/ha. C. acuminata based system followed the overall same trend and 0.875 t/ha yield was reduced for per unit increasing of canopy spread.
A negative but highly significant relation was observed under M. indica and O. europea based agroforestry system. As the canopy volume of M. indica and P. guajava were dense, light hardly penetrated through its canopy to the ground level. So, light availability was lower under these two trees. Hence, under M. indica based agroforestry system, yield decreased at the rate of 5.3439 t/ha and under O. europea species it was 3.2521 t/ha for per unit changing of canopy spread.