What is Statistics?
Statistics is the scientific application of mathematical principles to the collection, analysis, and presentation of numerical data. Statisticians contribute to scientific enquiry by applying their mathematical and statistical knowledge to the design of surveys and experiments; the collection, processing, and analysis of data; and the interpretation of the results.
Statisticians may apply their knowledge of statistical methods to a variety of subject areas, such as biology, economics, engineering, medicine, public health, psychology, marketing, education, and sports.
Some definitions in statistics are below:
Statistic is FIBMP. It’s called “Statistic is Fiancé, Investment, Bank, Marketing, and Production.
The Croxton & Cowden are says “Statistic is COPAI”
Its mean “Statistic is collection”
“Statistic is organizing”
“Statistic is presenting”
“Statistic is Analyzing”
“Statistic is interpretation”
The Boddington says “Statistics is science of estimate”
“Statistic is science of predication”
The “Bowley says “CAM” they are “Statistic is country, Average & measurement”.
Types of statistics
There are two types of statistics.
- Descriptive Statistics
- Inferential Statistics
(1)Descriptive statistics
Descriptive statistics summarize the population data by describing what was observed in the sample numerically or graphically. Numerical descriptors include mean and standard deviation for continuous data types (like heights or weights), while frequency and percentage are more useful in terms of describing categorical data (like race).Descriptive statistics are as simple as the number of children in each family along a city block or as complex as the annual report released from the U.S. Treasury Department. Consider two ways of representing descriptive statistics: numerical and pictorial.
Numerical statistics
Numerical statistics are numbers, but clearly, some numbers are more meaningful than others. For example, if you are offered a purchase price of $1 for an automobile on the condition that you also buy a second automobile, the price of the second automobile would be a major consideration (its price could be $1,000,000 or only $1,000), and thus, the average—or mean—of the two prices would be the important statistic.
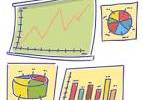
Pictorial statistics
Taking numerical data and presenting it in pictures or graphs is what is known as pictorial statistics. Showing data in the form of a graphic can make complex and confusing information appear more simple and straightforward.
(2) Inferential statistics
Inferential statistics uses patterns in the sample data to draw inferences about the population represented, accounting for randomness. These inferences may take the form of: answering yes/no questions about the data (hypothesis testing), estimating numerical characteristics of the data (estimation), describing associations within the data (correlation) and modeling relationships within the data (for example, using regression analysis). Inference can extend to forecasting, prediction and estimation of unobserved values either in or associated with the population being studied; it can include extrapolation and interpolation of time series or spatial data, and can also include data mining.
Levels of measurement
There are four main levels of measurement used in statistics: nominal, ordinal, interval, and ratio. Each of these has different degrees of usefulness in statistical research. Ratio measurements have both a meaningful zero value and the distances between different measurements defined; they provide the greatest flexibility in statistical methods that can be used for analyzing the data.[ Interval measurements have meaningful distances between measurements defined, but the zero value is arbitrary (as in the case with longitude and temperature measurements in Celsius or Fahrenheit). Ordinal measurements have imprecise differences between consecutive values, but have a meaningful order to those values. Nominal measurements have no meaningful rank order among values.
Because variables conforming only to nominal or ordinal measurements cannot be reasonably measured numerically, sometimes they are grouped together as categorical variables, whereas ratio and interval measurements are grouped together as quantitative or continuous variables due to their numerical nature.
Limitation on statistics in use
Actually, statistics is an exact science. It is the application of the results that leads to problems.
Perhaps the most commonly encountered limitation of statistics is the misunderstanding that a statistical measure can be used as a measure of the accuracy of a measurement.
Statistics, in general, provide very little information on the intrinsic accuracy of a measurement. Statistics can only provide an estimate of the minimal error that might be in the measurement. The actual error can be much greater than the minimal (statistical) error.
Another way to put it is that statistics measure the variability of a measurement, not the accuracy of a measurement.
Statistics is indispensable to almost all sciences – social, physical and natural. It is very often used in most of the spheres of human activity. In spite of the wide scope of the subject it has certain limitations. Some important limitations of statistics are the following:
1. Statistics does not study qualitative phenomena:
Statistics deals with facts and figures. So the quality aspect of a variable or the subjective phenomenon falls out of the scope of statistics. For example, qualities like beauty, honesty, intelligence etc. cannot be numerically expressed. So these characteristics cannot be examined statistically. This limits the scope of the subject.
2. Statistical laws are not exact:
Statistical laws are not exact as incase of natural sciences. These laws are true only on average. They hold well under certain conditions. They cannot be universally applied.So statistics has less practical utility.
3. Statistics does not study individuals:
Statistics deals with aggregate of facts. Single or isolated figures are not statistics. This is considered to be a major handicap of statistics.
4. Statistics can be misused:
Statistics is mostly a tool of analysis. Statistical techniques are used to analyze and interpret the collected information in an enquiry. As it is, statistics does not prove or disprove anything. It is just a means to an end. Statements supported by statistics are more appealing and are commonly believed. For this, statistics is often misused. Statistical methods rightly used are beneficial but if misused these become harmful. Statistical methods used by less expert hands will lead to inaccurate results. Here the fault does not lie with the subject of statistics but with the person who makes wrong use of it.
Is Statistics Science or Art?
Science refers to a systematized body of knowledge. It studies cause and effect relationship and attempts to make generalization in the form of science principles or laws.
Statistics is an art as well as a science, so it’s important to use it as you would any other tool: you have to know what you want to get out of your statistics before you can choose the right way to apply them. Therefore, let’s start with some philosophy.
First, statistics are not magic! If the data aren’t good enough, no amount of statistical manipulation will bring out the results. If your data are exceptional, the main results are often evident even without lots of massaging. Nonetheless, there are plenty of cases in the middle (where only good statistics will work), and it’s appropriate to be rigorous when possible anyway.
Second, in astronomy systematic is often a major issue. An important principle is that hypotheses are tested in bundles. When you make an observation, you aren’t measuring the physical quantities of the system directly. You make implicit assumptions about your knowledge of the instrument, and often need to make explicit assumptions about a basic model, to get the quantities that really interest you. Often there are enormous uncertainties as a result. This means that the statistical significance you quote may not be representative.
Statistics is the science of collecting, organizing, presenting, analyzing, and interpreting numerical data for the purpose of assisting in making a more effective decision.
Art, on the other hand, refers to the skill of handling facts so as to achieve a given objective. It is concerned with ways and means of presenting and handling data making inferences logically and drawing relevant conclusions.
Statistics may thus be viewed both science and art.