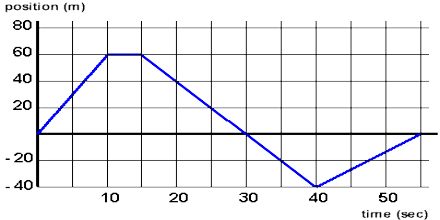
Prime purpose of this lecture is to present on Position vs Time Graphs. Here briefly describe what would a position vs time graph look like of your desk as measured from the chalkboard -for the entire class period. The gradient of a distance-time graph represents the speed of an object. The velocity of an object is its speed in a particular direction. The slope on a velocity-time graph represents the acceleration of an object. The distance traveled is equal to the area under a velocity-time graph.
More Post
-
Discovery of “Cotton-Candy” Planet Helps Rewrite How Gas Giants Can Form
-
Repayment Behavior of Retail Loan Borrowers in BRAC Bank
-
A Mediterranean diet enhances Fertility in addition to Overall Health
-
Know about Nanotechnology
-
Annual Report 2016-2017 of United Bank of India
-
Global Communication of Bangladesh
Latest Post
-
Cathodic Protection – a technique for controlling corrosion
-
Electromagnetism – a discipline of physics
-
Astronomers Measure the Heaviest Black Hole Pair ever Discovered
-
Even Passive Smokers are Extensively Colonized by Microbes
-
Webb discovers Proof that a Neutron Star powers the Young Supernova Remnant
-
Flyback Transformer (FBT)