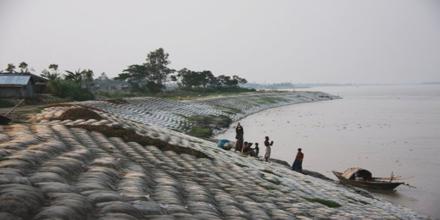
Dhaka is prone to flood hazard due to its location, topology, climate and proximity to rivers. The main objectives of this study are to delineate the flood extent, find out the flood duration during monsoon, identify the change in land use and find out mitigation measures to reduce the impact of flood hazard in Dhaka. In this report, the flood types, causes of flood, flood history and flood control, and flood mitigation measures for Dhaka district are discussed. The study is based on review of literature, analysis of satellite images and water levels, and interviewing of some key informants. Due to its location, Dhaka is found to be susceptible to both fluvial and pluvial types of flooding. Drainage congestion is another major problem in Dhaka during the monsoon due to unplanned rapid urbanization, poor drainage system and improper maintenance of sewerage and drainage system. At present, Dhaka does not have any integrated long term flood risk management plan. A multi-scale, delta perspective flood mitigation focus, which involves long term adaptive management, is not yet in place. Green water defense, which is an adaptive management approach for delta regions, can be one of the best flood mitigation approaches, for Dhaka, both in city and district scales.
Background
Bangladesh is a natural flood hazard prone country for its unique geographical location. The major trans-boundary rivers, the Ganges, the Brahmaputra and the Meghna drain all their water from more than 90% of their catchment lying outside the country (Islam et al., 2014).
Almost every year, a part of the country faces flood, sometimes which goes beyond the limit of people‟s tolerance. The impact of annual monsoon flooding, on the social, environmental and economic conditions of Bangladesh, is of great concern. This necessitates not only relief and rehabilitation measures but also management of the agencies involved in mitigating the floods and assessing their miseries.
Dhaka is highly prone to flood, due to its location, topology, climate and proximity to rivers. Some of the main factors contributing to flooding Dhaka, include spillover from surrounding rivers, excessive rainfall and limited and congested drainage. River floods generally take place in the low-lying fringe areas outside the protective embankments once in every five to ten years (Barua, 2008). As Dhaka is the capital city of Bangladesh, development is more here than that of the other parts of the country. Many people have migrated and started to live in Dhaka to achieve their desires. Therefore, almost the whole district meet population problem. For this, land development through land-filing is now increasing to meet up the accommodation space for increasing population. Consequently land subsidence is also a parallel event to contribute water logging, which increases the internal drainage problem here. This becomes acute during rainy season, when some areas of the city can be inundated for weeks with inundation reaching as high as 40 to 60 cm (Huq and Alam, 2003). On global scale (Casale and Margottini, 1999), storms and floods are more destructive of natural disasters and cause the greater number of deaths.
Some structural and non-structural measures have been taken by government to mitigate flooding problem both for Dhaka. As Dhaka is expanding rapidly like other south Asian countries it is necessary to have some new adaptive ways to mitigate flood. The study intends to find out the probable mitigation measures and adaptation techniques for Dhaka.
Objectives of the Study
The study will be carried out for the fulfillment of following objectives:
- Delineate flood water extent using remote sensing technology.
- Find out the duration of flood using river water level.
- Find out the land use changes of Dhaka district of last 25 years using remote sensing and GIS technologies.
- Find out the probable mitigation measures using Green Water Defense (GWD) approach.
Importance of the Study
The rural and urban poor of this district, living in slums and shantytowns often in low-lying areas, have limited assets and are amongst the most vulnerable. With rapid and unplanned urbanization as well as habitation, people’s vulnerability is likely to increase unless appropriate adaptation measures are put in place. At present, Dhaka does not have any integrated long term flood risk management plan, a multi-scale, delta perspective flood mitigation focus, which involves long term adaptive management, is not yet in place.
History of Flood and Flood Control in Bangladesh
Extreme precipitation together with the physical setting of the river basins has caused many severe floods in the last few decades of 20th century and the early decade of 21st century.
Dhaka experienced the major floods in 1954, 1955, 1970, 1974, 1980, 1987, 1988, 1998 (Huq and Alam, 2003) and also in 2004. The unusual severe flood events like 1988 and 1998 inundated more than 60% of the country with severe destruction and damages to households, standing crops, livestock and infrastructure (Huq and Alam, 2003).
Considering the impacts of monsoon floods, regular monitoring and a good understanding of the nature of the floods are needed at the onset including the peak and recession periods of floods. In 1957 the Krug Mission (a United Nations Water Control Mission requested by the then Government of Pakistan) recommended to prepare a master plan for flood problems after the severe flood of 1954 and 1955. Consequently, in 1959 the East Pakistan Water and power Development Authority (EPWAPDA) was created to prepare a comprehensive plan for the development and utilization of the water and power resources in East Pakistan (currently Bangladesh). The master plan completed in 1964 (Mazumder, 2005) emphasized large scale flood control, drainage and irrigation projects to enhance agricultural production.
Afterwards in 1972, the International Bank for Reconstruction and Development (IBRD) recommended small-scale short term Flood Control and Drainage (FCD) projects like low lift pump irrigation and small drainage improvements and some medium-scale projects to face or mitigate the problems of flooding during the wet season and the scarcity of water during the dry season. In 1983 the National Water Plan (NWP) project was initiated under the Master
Plan Organization (MPO) to formulate a perspective plan (1985-2005) for water resources development. The main objective of NWP was to maximize agricultural production while meeting the basic water needs of the users (Mozumder, 2005). MPO became Water Resources Planning Organization (WARPO) under act no. xii of 1992.
In the two consecutives disastrous flood of 1987 and 1988 huge damage took place in crop production, roads, railways, cities and towns, and more than thousand people lost their lives.
In this connection, Flood Plan Coordination Organization (FPCO) was created in 1989 to coordinate Flood Action Plan (FAP) activities and has been merged with WARPO in January 1996. The goals of FAP study were to protect rural infrastructure, agriculture, fisheries; to create effective land and water management and to maintain the navigation along rivers; to increase and improve awareness for flood preparedness and disaster management; to reduce flood flows in major rivers; to recommend structures and embankments to protect the region; to coordinate planning of Roads and railways with embankments along with clear drainage for flood water; and to create global awareness of floods and control efforts for possible relief and monetary efforts.
About 127 coastal polders were constructed for the management of tidal floods in coastal region. However these structural measures of flood management had impacts on nature like impacts on hydraulic system, floodplain ecosystem and water transport function, crop production etc. According to Chowdhury, (2000) flood control embankments cause substantial damage during large and moderate floods; even the damage during smaller floods is also quite high. Due to embankment failure, it results very high damage compared to that in “without embankment” situation (Rahman and Salehin, 2013).
The concept of tidal river management (TRM) is compartmentalization in central Brahmaputra floodplain and partial flood control in the north-eastern part of Bangladesh is established considering the impacts of structural measures in coastal (Rahman and Salehin, 2013). The Government has invested a large amount of fund for flood control and drainage systems through the construction of 12,850 km of embankments, 25,580 km of drainage channels, 4,190 nos sluices and regulators through Bangladesh Water Development Board (BWDB) till 1998 (WARPO, 2001a). The implemented projects were flood control (FC), flood control and drainage (FCD), flood control drainage and irrigation (FCDI); and drainage (D) projects. The main approaches were for the protection of the agricultural lands and urban areas constructing embankments, construction of low height submersible embankments for the north-eastern part of Bangladesh for the protection of boro rice in pre monsoon period from early flash flood, evacuating unwanted rainwater within the embankment through drainage regulators and sluices and providing drainage by pumping (Rahman and Salehin, 2013).
Environment and GIS Support project for Water Sector Planning (EGIS) and its predecessor Irrigation Support Project for Asia and the Near East (ISPAN) have explored the mapping and monitoring of floods from 1993. EGIS monitored flood extent of 1998 flood and the information were provided to different government and non-government agencies active in relief and rehabilitation and in the field of flood disaster management.
The monitoring of the monsoon floods in Bangladesh is presently focused on extreme events and on providing information to support relief and rehabilitation. National agencies such as the Flood Forecasting and Warning Center (FFWC), BWDB (established in 1972) and the Bangladesh Meteorological Department (BMD) regularly monitor hydrological and meteorological conditions at a number of selected river gauges and rainfall stations. FFWC generates information for the flood forecasting and warning system using mathematical modeling techniques and updating the tools for a more dependable and reliable forecasting system.
According to Smith, (1997) accurate information on the extent of water bodies is required for management of flood. Mapping of flood extent and the vulnerable areas not yet identified will be very helpful to measure the losses and to take necessary actions for those areas. In this regard, now-a-days, GIS techniques are broadly used all over the world to model flood hazard using Digital Elevation model (DEM) (Dewan et al., 2004).
Government Response to Flooding Problem in Dhaka
The FAP (1990-1995) was involved 26 components as the initial stage in long term development for flood control, drainage and river management in Bangladesh. As a part of this the Government of Japan and the Asian Development Bank (ADB) agreed to undertake a study on Dhaka protection FAP 8 in 1990. There were two components of FAP 8 and those are: Flood Action Plan 8A “Greater Dhaka Protection Project- Study in Dhaka Metropolitan Area” and Flood Action Plan 8B “Dhaka Integrated Flood Protection Project”. The main focus of FAP 8A was to mitigate flood and storm water drainage improvement for the Dhaka metropolitan area. FAP 8B conducted by Louis Berger International and funded by ADB proposed an integrated flood protection and drainage program for Dhaka city.
The Water and Flood Management Strategy (WFMS) for Bangladesh was developed in 1995 for 5-year to prepare the National Water Management Plan (NWMP) (Mozumder, 2005).
Following the FAP 8A study, the “Dhaka Eastern Bypass Study” was undertaken by Halcrow Fox in 1996 with the funding of the World Bank. Together with BWDB, in 1999 the Roads and Highway Department (RHD) started constructing a bypass road along an alignment which was completed in 2006 (Halcrow, 2006). According to WARPO, (2001a), Bangladesh has been divided into five regions, where Dhaka falls within the North Central (NC) region which was established by NWMP in 2001.
In the program of NC region Dhaka flood protection project was started for 23 years in 2003 where the project would be implemented Dhaka integrated flood control embankment (Eastern Bypass Road Multipurpose Project). Another study under this project has been started in 2004 for 22 years on storm water drainage in Dhaka. The objective is to propose infrastructure development. In this regard Dhaka Water Supply and Sewerage Authority (DWASA) has recently prepared the “Storm Water Drainage Master Plan”.
In 2004, DAP (Detail Area Plan) was prepared by Rajdhani Unnayan Kartripakkha (RAJUK) with the assistance of United Nations Development Programme (UNDP) and United Nations Center for Human Settlements (UNCHS) under the project “Preparation of Structure Plan (SP), Urban Area Plan (UAP) and Detailed Area Plan (DAP)- Metropolitan Development Plan Preparation and Management in Dhaka” (DAP, 2004). The objectives are to implement the previous Dhaka Metropolitan Development Plan (DMDP), Structure Plan and Urban Area Plan, policies and recommendations. It provides more detailed planning proposals for specific sub areas compliant with the Structure Plan and the Urban Area Plan.
According to RAJUK, (2010b) Dhaka City west area is protected by a flood control embankment. Moreover, internal drainage is provided by pump stations located at Goranchant Bari, Kallanpur, Narinada and Rampura. There are eleven sluices on the embankment, also serve for draining storm water from the city area. On the other hand, almost the total area of eastern part of Dhaka remains under flood water during monsoon excluding some areas like Uttarkhan and Ujanpur. Generally drainage impediment is a serious issue for the area and it is very difficult to find flood free land in the rainy months.
However, the DND (Dhaka-Narayanganj-Demra) dam and development of Pragati Sarani and Sayadabad road in this area along with rising of Pragati Sarani for flood proofing flow to Narinda khal has practically ceased. Therefore, Mugda, Khilgaon-Basabo, Zirani and Manda khals are to flow towards Rampura khal and drain to the Balu river (RAJUK, 2010b). Change in Land use is another problem to manage flood control in Dhaka. This should be looked into with intense care.
Change in Land Use in Dhaka
As Dhaka is expanding rapidly, it is required to have more space for living. Uncontrolled urbanization should be regulated. Water bodies like lakes, beels and low lying lands are now filled up and uncontrolled development in high risk zones together with environmental degradation leads towards increased vulnerability and catastrophic events for the communities living in the floodplains.
For this, water logging is now a great issue in monsoon period. According to Haq and Alam, (2003) land development through land-filling in Dhaka has caused drastic reduction in water storage area and easy passage of the flood water into the river system as well. This becomes acute during the rainy season when some areas of the city can be inundated for weeks with inundation reaching as high as 40 to 60 cm. On the global scale, storms and floods are most destructive of natural disasters and cause the greater number of deaths (Fattorelli et al., 1999). Barua, (2008) argued the embankment without proper pumping system has increased the internal drainage problem of the city resulting into a management problem.
According to WMO/GWP, (2008b), human activities encroach on the natural environment with the progress of urbanization. It disrupts natural drainage patterns and natural watercourses are destroyed as well. The natural retention of runoff by plants and soil is also removed. Thus, the natural water storage capacity of soil is declined.
International Experiences for Flood Management
The integration of both structural and non-structural measures for flood management is not a recent idea and has been present in numerous water management practices (Petry, 2002). Miller, (1997) cited by Petry, (2002) and Calder and Aylward, (2006) added, the reduction of flood damages requires a combined application of three different strategies to the problem of flooding and are: “keep the flood away from people”- through construction of structural measures and “keep people away from floods”- through land use planning and finally, “accept floods and clean up afterwards”. In company with, Tucci, (2006) structural measures are engineering works implemented to reduce the risk of flooding.
Along with Petry, (2002) the Tucurui Dam and Hydropower station were constructed on the lower course of the Tocantins River which is the tributary of the Amazon in northern Brazil. The Pacaembu underground reservoir was constructed at the adjacent to one of the main Brazilian soccer stadia to regulate the flood flows resulting from intense rainfall events and avoid exceeding the capacity of the existing urban drainage system. A flood protection plan in Taipei was approved in 1973 and implemented until 1996 through constructing 2 reservoirs, 79 pumping stations, 124 water regulation gates, a flood-bypass channel and 68 km of dikes.
In the Netherlands dikes are used for the protection of land from flooding with a safety level; varying between 1:1250 (in the eastern part, where the Rhine River enters the Netherlands) and 1:10000 (at the western part, at the North Sea side) (Schielen and Roovers, 2008). Petry, (2002) added, the two major projects: the Zuiderzeein Project in the northern coastal range and the Delta Project in the south (delta of Scheld River) were implemented during the second half of the twentieth century that strongly contributed to further advances in land reclamation and further progress in managing floods.
Structural measures are not designed to give total protection (Tucci, 2006). Patel and Dholakia, (2010) added, non-structural measures are essential together with structural measures to achieve entire efficiency, effectiveness and economy of development. Flood forecasting and warnings are very helpful for the management of flood. BANCID (1995), explained the opinion, like, “Flood forecasting and warning has been identified as a key component that could exert major benefits on numerous aspects of national life, with considerable potential for improving the national economy. As such it is recognized as a highly cost effective non-structural measures”. Parker and Fordham, (1996) and Plessis, (2002) added that flood forecast, warning and response system are implemented to reduce material, human and cultural losses in Europe and South Africa.
According to Islam et al., (2014) nowadays, flood monitoring based on remote sensing and GIS is a well-established activity for flood management all over the world. Wei, (2012) supplemented that the multisource satellite remote sensing data are now covering many aspects of flood monitoring and development was found feasible. Menzel et al., (2003) expressed his opinion on watershed management as flood management which includes land use soil conservation to minimize surface run-off, erosion and sediment transport. Karen et al., (2009) have given extensive reviews on this issue also.
However, Tu and Nitivattananon, (2010) argued, adaptation strategies of flood can be another option to manage flood. The adaptation techniques might be like increase in efficient use of water and reduce the water pollution, create floodwater and rainwater storage facilities to reduce water overflow and reuse rainwater for irrigation and other utility purposes, improving water treatment like management of waste water management and urban planning and infrastructure development.
According to the report of WMO/GWP (2008a) flood risks cannot be avoided and should be managed in an integrated way- risk assessment, planning and implementation of measures, evaluation and risk reassessment.
Study Area and Methodology
Description of the Study Area
Dhaka, the capital city of Bangladesh, is under Dhaka district which is located in central part of Bangladesh. It is the densest district of Bangladesh and the total area is about 1,464 sq km. The area is located latitude of 23.79° N and longitude of 90.30°E. The district consists of 46 thanas, 208 unions including 98 Wards. The district shares its border with Gazipur and Tangail to the North; Munshiganj and Rajbari to the South; Narayanganj to the East and Manikganj to the West. There are 2 city corporations covering about one fifth area of the district.
The Dhaka district is surrounded by the rivers, Balu, Bangshi, Buriganga, Dhaleshwari, Lakhya, Tongi Khal and Turag. Dhaka elicits an average of 1875 mm (73.8 in) of rainfall per year, or 156.3 mm (6.2 in) per month. The high flow of the trans-boundary river, the Brahmaputra-Jamuna coincide with heavy rainfall during monsoon, the rivers in and around this district, overflows the low-lying fringe areas and causes flood in Dhaka.
Moreover, population problem is now an important issue here. Many people migrate here from other areas of the country, in search of better livelihoods. For this, it is expanding rapidly with dense population, that causes drainage congestion. In addition, Dhaka is now suffering in poor drainage congestion also. Land filling is another cause for proper drainage of rain water during monsoon. Thus, it is now getting more vulnerable to disaster like floods and earthquakes, for land filling and over population.
After having the flood protection embankment within the DND boundary, Dhaka west is now safe from fluvial flood. However, the scenario is opposite for the non- protected area like Dhaka East. As flood plain, as well as agriculture land, is decreasing over the three decades, food production is now also in threat. For this, it is required to have proper mitigation measures against flood and water congestion and selected as the study area of this dissertation.
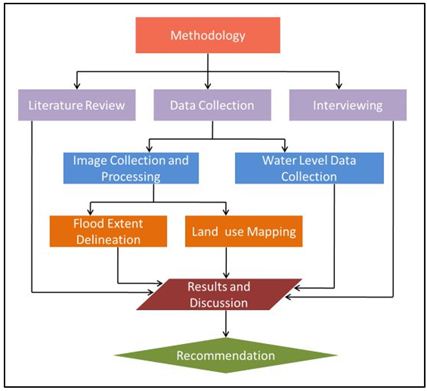
Methodology of the Study
The overall methodology of the study consists of three parts and these are literature review, data collection and taking interviews. The flow diagram of the whole methodology is given in
Figure: 1
Data collection
Data collection part is consists of image collection and water level data collection of Dhaka district.
Satellite image collection and processing
Two types of satellite images were collected from the Remote Sensing Division of CEGIS. To understand the area extent of flood Dhaka district, available RADARSAT images of 7 years (1998, 2000, 2001, 2002, 2003, 2004 and 2007) were collected from CEGIS. Landsat images were collected for identify the land use/ cover changes over the time period of 1989 to 2014. In this part, the two types of satellite images were processed as well as classified in two different ways. The procedure of processing both satellite images are given below-
Flood extent delineation
Different time series of similar year were available in CEGIS. To understand the flooded and non- flooded areas and flood duration of a year, each image was classified into two classes. The whole process was done by using ERDAS IMAGINE software, which is specially used for satellite image processing as well as analyzing satellite image data (ERDAS Field GuideTM, 2008).
The major processing steps followed in processing the images were: image to image registration (co-registration), filtering and geo-referencing. There are two major steps in analyzing an image using the above software are image processing image classification (Figure 2).
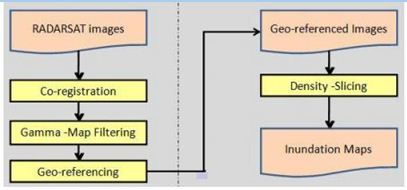
In many cases, images of one area that are collected from different sources must be used together. To be able to compare separate images pixel by pixel, the pixel grids of each image must conform to the other images in the data base. The tools for rectifying image data are used to transform disparate images to the same coordinate system. Registration is the process of making an image conforms to another image.
After co-registration, all RADARSAT images were filtered using a 3×3 Gamma-Map filter to reduce speckle noise in the images. The filtered SAR images were then geo-referenced into the BTM projection system. The accuracy of the geo-referencing was found to be within a pixel.
Geo-referencing refers to the process of assigning map coordinates to image data. The image data may already be projected onto the desired plane, but not yet referenced to the proper coordinate system. Rectification, by definition, involves geo-referencing, since all map projection systems are associated with map coordinates. Image-to-image registration involves geo-referencing only if the reference image is already geo-referenced. Geo-referencing, by itself, involves changing only the map coordinate information in the image file. The grid of the image does not change.
Bangladesh Transverse Mercator (BTM) projection parameters are as follows:
- Projection Type: Transverse Mercator
- Datum: Everest 1830
- Spheroid: Everest 1830
- Latitude of Origin: 0.000000
- Central Meridian: 90.00000
- Scale Factor: 0.999600
- False Easting: 5000000
- False Northing: -2000000
- Linear Unit: Meter
The Datum and Spheroid (Everest 1830) have the following parameters:
- Semi major Axis: 6377276.34499999970
- Semi minor Axis: 6356075.41314024010
- Inverse Flattening: 300.801699999999980
After geo-referencing, each image was classified into two categories: “Open Water Flooding” and “Non-Flooded Area”. The C band of RADARSAT-1 data cannot penetrate vegetation canopy (CEGIS, 2014). Previous experience of CEGIS indicates that it is not possible to detect floodwater under the cover of forests, settlements and homestead trees, and crops with more than 30% canopy. Hence “open water flooded area” is used instead of “flooded area”.
Each individual image was classified separately using density slicing technique. This technique grouped the digital number (DN) into two classes, “open water flooded area” and “others”. The DN threshold used to separate open water flooded area from the other land cover was identified. It was seen that the low valued DNs (i.e. the darker pixels) represented the open water category. After identification of open water flooded area, the rest of the digital numbers were classified as “Non-Flooded Area”. This group contained the combination of everything else that included urban and rural settlements, high canopy forests, agricultural crops without water underneath, and crops having greater than 30% canopy with water underneath. Finally, all classified flood maps were filtered using neighborhood majority functions with 3 x 3 window size.
After classification, area calculation was done. From the flooded areas the duration of flood was found out for that year. Analyzing the flood water extent of various dates of 1998, 2000, 2001, 2002, 2003, 2004 and 2007, maximum flood extent was delineated for those years individually. Using all the maximum flood extents of those years, a map was prepared based on the proneness of flood hazard.
In this research, an indicator based participatory approach was used for flood vulnerability assessment of the study area with respect to union boundary (administrative unit) by using following equation-
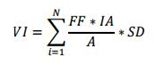
Where,
VI= Vulnerability index
FF= Flood Frequency of each union
IA= Total Inundated area
SD= Settlement Density
A= Union Area
N= Number of union
The information used in this study, was based on the analysis of geo-data, such as settlement and maximum flood water extent and flood hazard prone area maps, derived from satellite images and GIS data as well as census data. After then union based maximum flood inundated area and settlement density is calculated in spatial database. Flood intensity of each union is calculated by total inundated area and frequency weight whereas flood frequency is weighted into 0 to 5 (5 is the maximum occurrence and 0 is the no flood affected area). For the intensity normalization each union, intensity score is divided by the respective union area. Finally Vulnerability index is calculated by multiplying intensity score with settlement density. For the practical implementation, above index was normalized by dividing the maximum vulnerability index score of the union to make the maximum vulnerability value is 1.
Land use mapping
Land use/ land cover of Dhaka district was mapped from a digital image classification of Landsat 4/5 images of 1989, 1997, 2010; Landsat ETM images of 2003; and Landsat 8 images of 2014. All the images were geo-referenced images and were collected from CEGIS archive. All the images have 30m spatial resolution.
Both visual and digital interpretation techniques were used to derive the Land use/Land cover information from these images. Field surveys were conducted to collect ground truth data for the information on current land use/ land cover, which are used for interpreting digital classification. Finally, land use/ land cover maps were produced by digital classification with the help of ground truth data. The methodology of land use/ land cover map preparation from satellite images is given below in Figure 3.
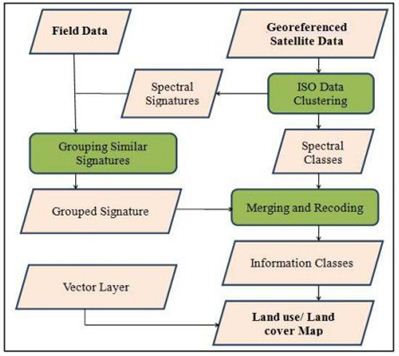
After visual interpretation, a digital unsupervised classification was done to derive different land uses/ land covers from satellite images. At first, 50 spectral classes were generated using an unsupervised classification method. ERDAS IMAGINE uses the ISODATA algorithm to perform an unsupervised classification. ISODATA stands for “Iterative Self-Organizing Data Analysis Technique.” It is iterative in that it repeatedly performs an entire classification (outputting a thematic raster layer) and recalculates statistics. “Self-Organizing” refers to the way in which it locates the clusters that are inherent in the data. The ISODATA clustering method uses the minimum spectral distance formula to form clusters. It begins with either arbitrary cluster means or means of an existing signature set, and each time the clustering repeats, the means of these clusters are shifted. The new cluster means are used for the next iteration. The ISODATA utility repeats the clustering of the image until either a maximum number of iterations have been performed, or a maximum percentage of unchanged pixels have been reached between two iterations.
The mean signature plot for each class was verified with ground truth data which was collected from the project of Ministry of Land of CEGIS. The similar spectral classes were grouped together and labeled with a land use/ land cover based on ground truth data. Finally, information classes such as Agricultural Land, Current Fallow Land, Bare Soil / Sand and Water were derived from 50 spectral classes. The settlement and forest parts were taken from the vector layer data collected from the CEGIS archive.
Flood duration delineation with water level data
All the water level data and danger level of the stations located within the district were collected from BWDB. The data were available from 1998 to 2007 of the months from June to October. The specific stations were Demra (SW7.5) on the Balu River, Nayarhat (SW14.5) on the Bangshi River, Mill Barak (SW42) and Hariharpara (SW43) on the Buriganga River, Savar (SW69) and Kalatia (SW70) on the Dhaleshwari River, Demra (SW179) on the Lakhya River, Tongi (SW299) on the Tongi Khal and Mirpur (SW302) on the Turag River.
First of all, one station was taken for analysis. The highest water levels for that station were arranged showing the danger level and found out in which year it crossed the danger level. This is because, if the water level does not cross the danger level in a year, we cannot say it as a flood year. All the water levels of that station were plotted and made a hydrograph. After getting the flooded year, water level versus month curve helped find out the duration of flood of that specific flooded year.
The similar process was done for all the stations for respected flooded year.
Key person interviewing
Eight key informant interviews (KII) have been taken for the authenticity of this study. The KIIs have been taken from the following key persons:
- Executive Engineer Flood Forecasting and Warning Center (FFWC), Bangladesh Water Development Board (BWDB).
- Former Director General, Water Resources Planning Organization (WARPO).
- Former Additional Director General, BWDB.
- Water Resources Expert, Water Resources Division, CEGIS.
- Director, Climate change Study and Disaster Management Division, CEGIS.
- Deputy Managing Director (Operation and Maintenance), DWASA.
- Chief Engineer, Project and Design, RAJUK.
- Superintending Engineer, Dhaka South City Corporation.
These key persons explained about the suitability of these adaptive approaches for Dhaka. They also explained, what would be the drawback and what measures should be taken in place to apply this approach for Dhaka.
Floods in Dhaka
Causes and Types of Flood
The distributaries of the two major rivers, the Brahmaputra and the Meghna surround the Dhaka district. The district is composed of low-lying areas and alluvial traces. The highest water levels in the surrounding rivers are affected by the discharge of the BrahmaputraJamuna River, local rainfall and also the backwater from the Meghna River when heavy rainfall occurs in the north eastern part of Bangladesh and a high tide in the Bay of Bengal usually in August – September (FAP 8A, 1991). Sometimes these may cause floods in Dhaka mostly when heavy rains coincide with the peak discharge of those rivers.
However, now-a-days drainage congestion is the main problem in Dhaka. Population growth is the impulsive factor for urban flooding in Dhaka. As a result, land- filling for developing land causes reduction of water storage as well as the easy passage of the flood water intoriver system. Thus, urban flood occurs in Dhaka.
Floods result from a combination of the following factors,
Meteorological factors:
- Rainfall
- Cyclonic storms
- Small-sale storm
- Temperature
Hydrological factors:
- Soil moisture level
- Groundwater level prior to a storm
- Natural surface infiltration
- Presence of impervious cover
- Channel cross- sectional shape and roughness
- Presence or absence of over bank flow channel network
- Synchronization of runoffs from various parts of watershed
- High tide impending drainage
Human factors aggravating natural flood hazards:
- Land use changes (e.g. surface sealing due to urbanization, deforestation) increase runoff and may be sedimentation
- Occupation of the flood plain obstructing flows
- Inefficiency or non-maintenance of infrastructure
- Poor drainage system
- Climate change affects magnitude and frequency of precipitations and floods
- Urban microclimate may enforce precipitation events
According to the factors, floods can be divided into two types in Dhaka and those are: local floods and riverine floods. Local floods generally occur due to very high rainfall during the rainy season and confined to small geographical areas and are normally not of long duration. Built environments like cities
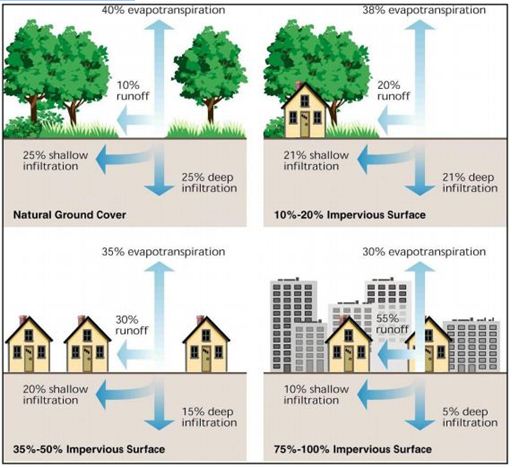
Figure: The influence of urbanization on different components of the water cycle1
generate higher surface runoff which exceeds local drainage capacity and causes local floods. Figure 4 shows how runoff increased and infiltration decreased due to urbanization. Unfortunately, in Dhaka, drainage facilities are not well enough due to lack of cleaning and maintenance of the drainage systems. Rubbish and solid waste clog and reduce the drainage capacity and increase surface runoff. Furthermore, rising in groundwater or surface flows can be other causes of local floods. Local floods may last for weeks and result in widespread destruction. Flood plains are subjected to annual flooding.
Food Duration
To find out the flood duration of Dhaka, the water level of the rivers surrounding the district were collected from BWDB. The water levels were available for the years from 1998 to 2007. In a flood year the water level exceeded the danger level of those rivers. Following figures show the hydrographs of the water level of Balu River at Demra station, Bangshi River at Nayarhat station, Buriganga River at Mil Barak and Hariharpara station, Tongi Khal at Tongi station, Turag River at Mirpur station, Lakhya River at Demra station and Dhaleshwari River at Savar and Kalatia stations in 1998.
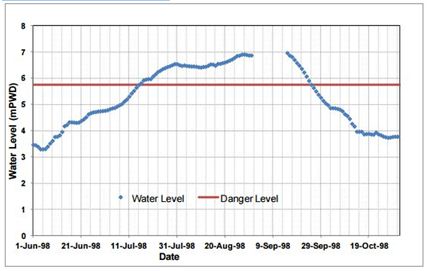
Fig: Water level hydrograph of the Balu River at Demra
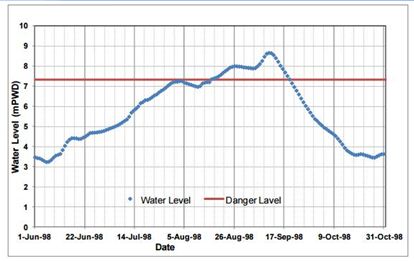
Fig: Water level hydrograph of the Bangshi River at Nayarhat
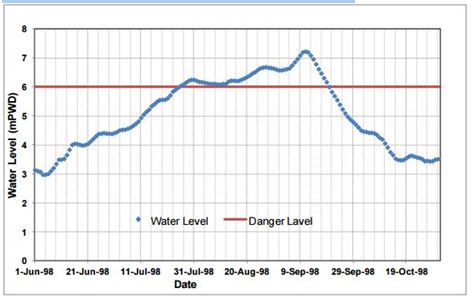
Fig: Water level hydrograph of the Buriganga River at Mill Barak
The above figures show, in the flood year, 1998, the duration of flood was from mid-July to mid-September. The hydro graphs of the rivers for the other years are given in ANNEX A section of this report.
In the figure of the hydrograph of the Balu River at Demra station, in the ANNEX A part it is seen that in 1998, 1999, 2002, 2003, 2004, 2005 and 2007 the water level was higher than that of the danger level of the Balu River (Figure A 1 and A 2).
Flood Extent
To delineate the flood water extent RADARSAT ScanSAR images were used of 1998, 2000, 2001, 2002, 2003, 2004 and 2007. After classification of the satellite images the Flood Extent Maps are shown in the following figures.
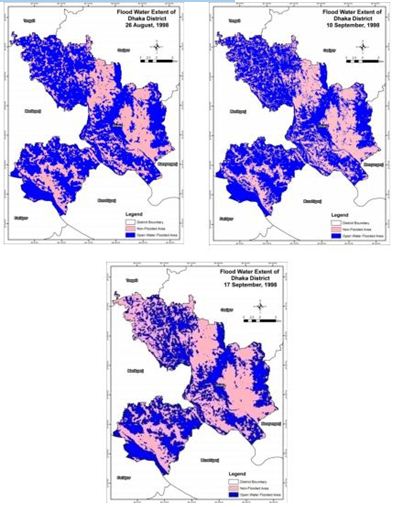
From the above figure, it is seen that after 10th September, 1998 flood water decreased gradually. Almost full of the district was under flood water in 1998 excluding some high lands.
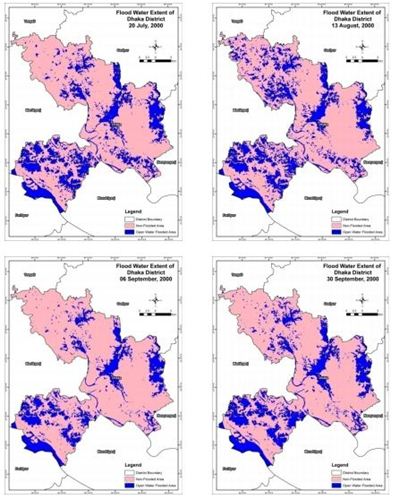
Figure shows the classification of the images of 2000. From the figure it is seen that, in August open water flooded area increased from the extent area of July. Then it decreased gradually in September and in October water was only present in the low lying area of Dhaka. The year, 2000 was not a flood year but the floodplains and some low-lying fringe areas were inundated during this year.
The scenario is similar for 2001 which was not a flood year. However, some places were inundated during monsoon.
Land Use Changes
To find out the land use changes in Dhaka district Landsat satellite images of 1989, 1997, 2003, 2010 and 2014 were used. After classification, the area statistics of land uses were generated for each year to understand the land use change trend within Dhaka district. The area coverage of each land use was measured in hectares.
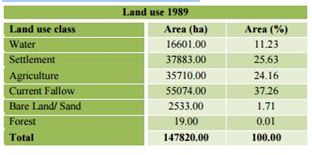
Land use of Dhaka district of 1989
The land use statistics of Dhaka district of 1989 are given in Table 4-1. The table shows that the highest percentage of area was fallow land in 1989 and the lowest was forest and they were 37.26% and 0.01% accordingly. As the image of 1989 was dry season images and the date was 12 January, 1989 and the cultivated land was only 24.16%. 25.63% and 11.23% of area was for settlement and water respectively.
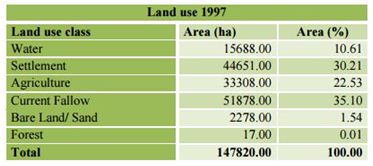
Land use of Dhaka district of 1997
The image used for 1997 was also dry season image and of the month, January. In this month most of the land was fallow and the highest percentage of total area of about 35.10 (Table 2). All the statistics are shown in the following table. Here, it is found that settlement area have increased in 1997 from the year 1989. The percentage of settlement area was 30.21 in 1997. Similar to 1989, in 1997 the lowest percentage of area was forest, which was 0.01.
Land use of Dhaka district of 2003
The land use statistics of 2003 are given in the following table. The highest and the lowest percentage of area were the fallow land and forest respectively. The percentages were 39.55 and 0.03. The percentage of the area of settlement, water and bare land/sand were 35.48, 4.85 and 1.57 accordingly.
Land use of Dhaka district of 2010
The land use statistics of Dhaka district of 2010 is given in the Table 4. In this year interestingly the percentage of the area of settlement increased highly and the percentage was the highest than that of the other area. The percentage of settlement area was 39.66 in 2010. The percentage of water, agriculture, fallow land, sand and forest were 4.26, 17.16, 34.78, 4.11 and 0.02 respectively in 2010. If we give a look on the percentage area of bare land/ sand in 2010 (Table 3), it can be said that the area increased more compared to 1989, 1997, 2003 and also 2014 (Table-1, Table-2, Table 4-3 and Table 4-5) which indicates between 2003 and 2010 most of the floodplains and water bodies were filled up. From the
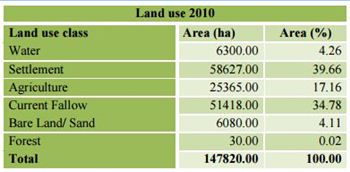
classification of images (Figure 4) as well as from field data it was found that the filled up areas are using for housing projects and buildings and apartments are constructed being constructed.
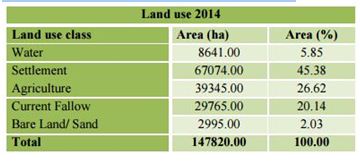
Land use of Dhaka district of 2014
In this year, the change in land use, in percentage is given in the following table (Table 4-5). In this year, the highest percentage of total area was for settlement and which was 45.38 and the lowest one was for bare land/ sand area which was 2.03. As the images of 2014 were of the month of March more crops are found in the field.
Green Water Defense for Flood Management in Dhaka:
A New Approach
Green Water Defense Approach for Flood Management
Green Water Defense (GWD) is an adaptive management approach which seeks to integrate natural forces and artificial interventions, and to balance incentive based and supply-driven measures, with minimum footprints and externalities in sustainably providing water services and managing related climate risks. Contrary to the conventional approach, GWD makes full use of the ecosystem services and balances structural and non-structural measures based on cost-effectiveness. The main focus of GWD is on adaptive management of physical scarcity.
In a study of The World Bank in collaboration with UNEP and others, GWD was promoted as an innovation to traditional ways of flood protection in which the protection is explained in a more holistic and natural way (Marchand et al., 2012). According to them, it is designed in a balanced structural and non-structural approach which is also eco-friendly. The main concepts are:
(i) types of flood hazard,
(ii) use of ecosystem processes and services and
(iii) measures related to the spatial occupation layer.
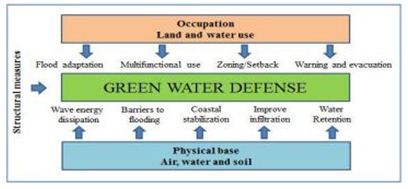
GWD highlights interaction between three layers: occupation layer which emphasizes on land and water, infrastructure layers are about building structure for flood protection such as dikes, zoning regulators etc. and the base layer describes how to manage air, water and soil (Figure5).
Types of flood hazard
GWD will work on three types of flood hazards:
- coastal floods those are caused by storm surge, tidal action or tsunami.
- fluvial or riverine floods those are originated from a river discharge and leads spill over onto the flood plain and sometimes excessive rainfall, thunderstorm etc. cause flash floods which is the special case of fluvial flood; and
- pluvial or rainfall floods those are usually occurred during monsoon period by excessive rainfall, failure of pumping stations and blockage in sewerage line and those cause drainage congestion in the urban areas.
Use of ecosystem processes and services (The base layer)
Ecosystem services are such benefits those are obtained from ecosystems. Ecosystem helps to modify and regulate hydrological and meteorological processes and affect the positive as well as the negative consequences of flood and storms. The functions of ecosystems range from the regulation of surface and sub-surface flow to the modification of wave dynamics in coastal and near-shore areas (Marchand et al., 2012). According to Mirzaet al., (2005) one of the important ecosystem services is to control floods and storm. On this lens ecosystem services are categorized into:
(i) Wave energy dissipation through coral reefs, vegetation and geomorphology
(ii) Barrier to flooding and elevated areas
(iii) Coastal Stabilization, erosion control and sediment retention for deltas
(iv) Reduction of water logging, improving infiltration and drainage, and
(v) Lowering of flood levels/ room for the river/ flood water retention
Brief discussion of each of the services is given below.
Wave energy dissipation through coral reefs, vegetation and geomorphology
In the coastal region where storm surges and tsunamis are destructive forces of nature reduction of high wave is very important for coastal environments. Coastal ecosystem like mangroves, coral reefs, seag6rass beds and salt marshes are such elements those can physically exert an effect of waves causing a hydraulic resistance that can break the waves and reduce the velocity and energy of the waves (Marchand et al., 2012). According to Hong and San, (1993) plantation is the way that helps in natural regeneration of some species.
Barrier to flooding and elevated areas
According to Marchand et al., (2012), geo-morphological features like dunes and river levees are natural flood protection systems by proving barriers to flooding and higher areas to keep dry feet. Although naturally formed dunes are usually characterized by small inlets and wash-overs, man often has closed these sea intrusions and thus formed a continuous high dune area that effectively protects the hinterland from flooding.
Coastal stabilization, erosion control and sediment retention for deltas
Due to strong winds, high waves and high tides and storm surge condition, coastal erosion is occurred. Coastal vegetation like mangroves plays a significant role in mitigating coastal erosion and promoting sediment deposition (Marchand et al., 2012).
Natural sediment dynamics play an important role in delta formation and sustainability (Marchand et al., 2012). Deltas are young landforms shaped by the interplay of coastal and riverine process compared to other lands. However, many of the deltas are now suffering from sediment deflects. This results from sediment starvation due to upstream developments and flood control measures. By preventing regular flooding of the delta, the river is not able to deposit sediments any longer. By protecting people from floods, environment is losing the benefits of flooding.
Mangroves are tidal forests those have protective functions:
(i) wave attenuation, mitigation of hydraulic forces of storm surges and tsunamis,
(ii) storm protection through windbreak and
(iii) shoreline stabilization, sediment retention and erosion control.
Reduction of water logging, improving infiltration and drainage
Vegetation leaves can hold part of rain water and act as an umbrella that reduces raindrop impacts on soils and decrease the risk of soil erosion and landslides in the catchments and urban areas (Marchand et al., 2012). Vegetation roots strengthen the soil and improve soil texture, which increases the water retention capacity. Organic matter from roots and leaves improves soil structure and increases both infiltration rates and water-holding capacity (Mirza et al., 2005).
Nowadays urban areas suffer from water logging and flood problems. Hydraulic processes in the urban areas are complex and relate both to water quality and quantity. One of the most conspicuous differences of urban areas from natural or agricultural area is the high percentage of impervious surface that can cover up to 75 to 100 % of the urban area (Marchand et al., 2012). Zevenbergen et al., (2011) added, this can lead to more than half of the precipitation flowing down as quick run-off, compared to 10% under natural conditions.
Permeable paving for roads and parking lots, urban wad and more green space can lead to an increase of infiltration capacity, thereby reducing the flood hazard. Green areas such as parks and water bodies also act as (temporary) retention areas. Zevenbergen et al., (2011) also indicated that, to reduce peak flows from surface runoff, process of storm water infiltration facilities and other best management practices termed as the sustainable urban drainage systems (SUDS) have, increasingly been implemented since the late 90‟s.
According to Marchand et al., (2012), green roofs are also rapidly growing in popularity. Green roofs do not only provide a habitat for insects and birds in a highly urbanized area, but also have a capacity of annually immobilizing up to 200 gm of dust and harmful air particles, purifying nitrates and other pollutants in the water and are capable of fifty to ninety percent of rainfall retention (Reinberger, 2009). In Germany people are using their properties as incorporate green infrastructure (Figure).

Proposed Green Water Defenses for Dhaka
As Dhaka district is very much prone to flood hazard due its location in delta, flood management using GWDs can play an important role for this district. Over the last three decades, it is seen that water bodies have been decreasing gradually causing water logging especially during monsoon period (Figures 4-19 and 4-20). Moreover, the floodplains have also been reducing and the areas getting full with settlements. For this reason, Dhaka is facing flood problems very much. Dhaka is associated with both fluvial and pluvial flood hazards and these can be mitigated by GWDs.
Green water defense for fluvial floods
The Balu, the Buriganga, the Lakhya, the Turag and the Tongi Khal are the river systems which have surrounded Dhaka. The river beds are filled up with sand due to sedimentation as well as human interventions. The river widths are also reduced as they are being encroached by the people. For this, in monsoon period the rivers do not have enough space for smooth passage of flood water and, hence, overflow of the bank occurs.
Four different types of actions can be taken up for fluvial flood management (Figure 5-4) and these are: upstream water retention, creating room for the rivers, flood defenses, and early warning and evacuation.
The rivers in and around Dhaka, are being off-taken from the two major rivers, the Brahmaputra-Jamuna and the Ganges-Padma in the upstream. These rivers are mostly sand braided and carry huge amount of sediments which fill the river bed and cause spillover during monsoon. As a part of holistic approach, the up-stream rivers should be well taken care of, for best management of Dhaka watersheds.
Keeping room for the rivers as a GWD approach is also applicable for the rivers in and around Dhaka district. This can be achieved through regular and proper dredging of the rivers. Unauthorized settlements and structures occupying the riverbanks and reducing the river width should also be immediately removed with hard hand.
Flood defense is another measure for fluvial flood management. The western part as well as the northern part of Dhaka city are embanked and can be said as risk free from fluvial floods.
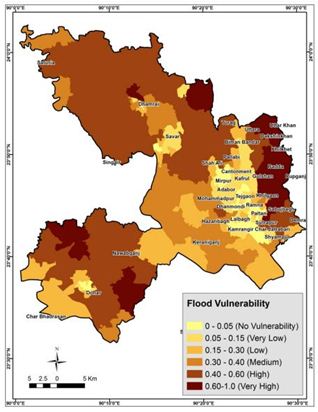
However, at the eastern part including Badda, Khilkhet, Khilgaon, Sabujhbagh and Demra (Figure 5-6) are most vulnerable areas and no flood protection measure is present. Moreover, the floodplains are filled up and unauthorized settlements are built in the floodplains which are intensifying the flood problem during monsoon. Figure 5-6 shows the area vulnerability due to flood hazard.
As there is no protection is present unlike the western part of Dhaka city, flood protection measures like embankment can be built at the eastern part of the city. Recently BWDB proposed a project named “Eastern Bypass” which is an embankment-cum-four lane road should also be implemented as early as possible.
The vulnerable areas should be under consideration to mitigate flood. The floodplains should be protected and new wetlands should be developed to use as water reservoir during monsoon.
Early warning system is already practiced in Bangladesh. The flood forecasting and warnings can be made quite accurate by using dependable data source and reliable model. Currently sometimes errors are made while taking the hydrologic readings which cause unwanted result for flood forecasting. These should be done with great care; otherwise, people cannot rely on the forecasts and warnings provided by the Flood Forecasting and Warning Center (FFWC) of BWDB.
Conclusions and Recommendations
Conclusions of the Study
As Dhaka is prone to flood, due to its geographical location and is growing up rapidly with an unplanned urbanization, flood is a great concern here. In this study, remote sensing technology has been used to find out the flood water extent during monsoon so that it was easy to find out the flood prone zone, due to flood, according to the extent of flood water during monsoon. Land use changes in last 25 years have been find out through the remote sensing and GIS techniques. It helped to identify the changes over the period of time so that it was clear that which areas would be taken under consideration to have initiatives for flood mitigation.
As the capital city of Bangladesh, Dhaka needs proper mitigation measures for it. Flood management is now getting more crucial. To reduce impacts of flood it is time to have more integrated approaches to solve this problem. Although some structural and non-structural measures have already been taken up for flood management in Dhaka, the measures are not sufficient to save all the vulnerable people from the adverse impacts of floods. Moreover, drainage congestion is now becoming another problem mainly in city areas during monsoon.
It is not possible to prevent flood hazard but can take adaptation as a mitigation measure to have less impacts on lives and properties.
Green water defense is a very useful measure and also cost effective to mitigate flood in Dhaka, by which, the problem can be managed successfully, if properly used. It focuses not only on one solution but also focuses the flood management including water management through holistic and natural way. It is more adaptive unlike traditional measures; those are costly and required proper maintenance. It can be used in multi-purposes having eco-friendly manner. It talks about both structural and non-structural measures; those can be used, based on the requirements of specific purposes.
Many countries in the world are now using this technique like rain water harvesting, roof top gardening and wastewater management to mitigate flood or lessen its adverse impact. Our government can take some initiatives like other countries, to have GWD measures for Dhaka.
As this technique is eco-friendly and cost effective, it will work successfully in Dhaka.
Limitations of the Findings
In this study, Radarsat-1 ScanSAR images were used to identify the flood water extent. The images were of coarse resolution, so that the results were not fully accurate. Furthermore, the C band of RADARSAT-1 data cannot penetrate vegetation canopy (CEGIS, 2014). Previous experience of CEGIS indicates that, it is not possible to detect floodwater under the cover of forests, settlements and homestead trees, and crops with more than 30% canopy. Moreover, if digital elevation model (DEM) could be used, it would be more relevant to find out the flood risk zone in Dhaka by using remote sensing technology, so that the study could be more rich and interesting. However, for its coarse resolution, DEM was not used for this study. Only eight key informative interviews (KII) were taken for this study. If more KIIs could be taken, the study could be more authentic.
Recommendations from the Study
This report provides knowledge on integrated flood mitigation measure as GWD. This knowledge should be disseminated to the government of Bangladesh through proper channel.
Different donor agencies should help to take this approach for the only megacity of Bangladesh. Environmental Impact Assessment should be done before taking this approach. Awareness should be built on general people’s mind to take some initiatives in household levels (roof top gardening, tree plantation etc.). As the World Bank has proposed first, to have this approach for delta regions, they are recommended to actively promote knowledge sharing.
In national level, government should take initiatives to have such integrated adaptive approach by planning demo project first and then go for active moves. Already the government of Bangladesh has taken such initiative like “Hatir Jheel Project” to have proper channel to drive rain water to the river. Taking some other initiatives government can help people from the adverse impact of flood.