Introduction:
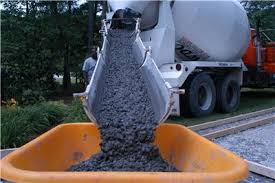
Ready Mixed Concrete is a high quality concrete made of carefully proportioned mixture of cement, aggregates, water and mixtures, manufactured under strictly controlled conditions in a centralized automatic batching plant and supplied to the customers in transit mixers for pouring/placement in the structure.
The quality of RMC is better than the conventionally mixed concrete due to it’s fully automated and strictly monitored production and quality control process. Ready mix concrete is sometimes preferred over on-site concrete mixing because of the precision of the mixture and reduced work site confusion. However, using a pre-determined concrete mixture reduces flexibility, both in the supply chain and in the actual components of the concrete.
Ready Mixed Concrete is also referred as the customized concrete products for commercial purpose. The Ready-mix Concrete Company offer different concrete according to user’s mix design or industrial standard. The ready mixed concrete company is required to equip themselves with up-to-date equipment, such as transit mixer, concrete pump, and Concrete Batching Plant, which needs visualized production management software and also PLC controller.
Origin of the report:
Internship program is essential for all MBA students, because it helps him or her acquit with real life situation. The real estate sectors play a significant role in solving the housing crisis in Dhaka city, so I have selected Amin Mohammad Group which is one of the leading companies in our country.
For completing my MBA degree Internship Report is one of the parts at the final semester of the Department of Business Administration, University of Dhaka, Bangladesh. This is a study on Costing of the Production and Delivery of Ready-Mix-Concrete on Land Owners of Amin Mohammad Group.. It was a chance for me to learn about the whole procedure of costing of Ready Mix Concrete.
Scope of the study:
This report will give us a clear picture about the costing of the production and delivery of Ready Mix Concrete in general &specially the activities of Amin Mohammad Group. The scope of the study is limited to organizational set up, functions, & performance. The scope of this study is:
Maintaining a good relation between employees & management to provide best RMC.
Improving an effective work station design on costing.
Effective layout design of delivery of product.
Efficient handling of employees.
Handling & setting the employees according to their work.
Maintaining the link with resources in an effective manner.
Objectives of the study:
The objective of the study is to find out the consumer attitudes towards AminMohammad Group. Especially the objectives of the study were as follows:
To know about the Ready Mix Concrete Of Amin Hohammad Group
Controlling process of concrete production by volume at site.
How to control over the water/cement ratio.
How to control over aggregate grading is difficult to archive.
Storage space for keeping constituent materials is no longer required at site.
Where and how the cost and effort of procurement or rental of plant and machinery is saved.
The process of noise and dust pollution at site is significantly reduced.
Process and-workforce management at site becomes methodical and streamlined
Methodology:
The methodology describes the procedures to organize the scattered ideas & views to conduct a study. Proper working procedure helps to capture the right things during study periods & finally fulfills the objective of the study. Generally a method involves a technique in which various stages of collecting data or information are interpreted. So, adoption of methodology is an important step in performing any study. In this study a methodology is followed for the achievement & successful accomplishment of the dissertation work. Relevant data from reliable sources have used while preparing the report. Both primary & secondary data have used where necessary.
Primary sources of data:
Face to Face convention with the cost accountants of Amin Mohammad Group.
Interview with the customers about their requirement on RMC.
Personal experience gained by visiting different desks of the company.
Secondary sources of data
Annual report of various year of Amin Mohammad Group
Prospects of Amin Mohammad Group (2012)
Different papers of Amin Mohammad Group
Un- published data
Different text book
Newspaper
Internet
Different manuals of Amin Mohammad Group
Different circulars of Amin Mohammad Group
Rationale of the study:
Internship program is essential for every student, especially for the student of Business Administration, which helps them to know the real life situation. For this reason a student takes the internship program at the last stage of the degree, to launch a career with some practical experience. The internship program is very helpful to bridge the gap between theoretical knowledge & real life experience as part of Bachelor of Business Administration (MBA) program. This internship report has been designed to have a practical experience though the theoretical understanding
Limitations:
The present study was not out of limitations. But it was a great opportunity for me to know activities of real estate business. Some constraints are appended bellow:
Every organization has their own secrecy that is not relevant to others. While collection data i.e. interviewing the employees, they did not discuss much information for the sake of the confidentiality of the organization.
The buyers were too busy to provide me much time for interview.
Load at the work place was also a barrier to prepare the report.
Another limitation was that the data gathered could not be verified for accuracy
Up-to-date information were not available
For the reason of confidentiality, some useful information cannot be expressed in this report.
Background and Literature Review
In today’s markets, manufacturing companies, especially small ones, struggle to increase their profits because of the high competitiveness and globalization. Therefore, more efforts are directed towards reducing production expenses. To this end, the impact of the various value-added, supporting, and non value-added activities on the cost of the product or service should be investigated.
Today, manufacturing companies are becoming more information intensive, highly flexible, and immediately responsive to the customer expectations. Due to the changing manufacturing environment, traditional cost accounting is rapidly disappearing. Traditional accounting systems were developed at a time when direct labor contributed to a large percentage of the total cost of the product. Changes in manufacturing technologies, such as the just-in-time philosophy, robotics, and flexible manufacturing systems decreased the direct labor component of production and increased overhead cost.
In today’s manufacturing environment, direct labor accounts for only 10% of the cost, whereas material accounts for 55% and overhead for 35%. As a result, product cost distortion occurs due to allocating overhead cost to the products arbitrarily on the basis of direct labor hours used by each product. Cooper reports several situations that can cause distortions to occur, examples include production volume diversity, complexity diversity, material diversity, and setup diversity. In the literature, several researchers applied ABC in real life. Examples include air conditioning industry, land transportation, agricultural systems, and healthcare.
ABC Costing:
ABC emerged as a logical alternative to traditional cost management systems that tended to produce insufficient results when it came to allocating cost. The concept of ABC came into prominence with the development of ABM by cooper and Kaplan in 1988. ABC concentrates on the need to make a more realistic allocation of overhead cost to products.
It emphasizes the requirement to obtain a better understanding of the behavior of overhead cost, and thus ascertains what causes overhead cost and how they relate to products ABC provides information to identify the components of overhead more precisely, assigns cost of resource to products more accurately, and as a result it acts as a decision support tool for companies. The implementation of ABC is justified if the cost of installing and operating the system are more than offsets by the long term benefits. Several limitations of ABC are presented in.
Element of ABC Costing:
Element of ABC include Activity: Work performed within an organization or the aggregations of action performed within an organization. Activity driver: Associates activates with their respective cost object. Activity drivers’ measure the frequency and intensity of the demand placed on activities by cost objects. They are typically a one-to-one relationship with the activity. Activity measures: A measure of the workload involved in the activity. It can be similar to the activity driver. Bill of activity: A listing of the activities required (and optionally, the associated cost of the resources consumed) by a product or other cost object.
It should list each activity, activity drivers, number of units, unit cost per driver, and extended cost that, taken together, compose the total for any particular cost object.
Cost drivers: Any element that would cause a change in the cost of activity.
Cost elements: An amount paid for a resource consumed by an activity and included in activity cost pool.
Cost objects: Any customer, product, service, contract, project, or other work unit for that separate cost measurement is desired.
Performance measures: Indicators of the work performed and the results achieved in an activity, process, or organizational unit. Performance measures may be financial or operational.
Processes: A series of activities linked to perform a specific objective.
Resources: An economic element that is applied or used in the performance of activities, salaries and materials are resources used in the performance of activities.
They can also include any non-monetary assets that are essential for the completion of the item. Resource drivers: A measurement tool to associate cost with their respective activities or cost object resources drivers measure the quantity of resources consumed by an activity, typically a one-to-one relationship with the resource.
Hierarchical Relationship among Expense:
Here Figure 1 illustrates the hierarchical relationship among expense categories, activities, and products. In, the authors proposed efficient and inexpensive steps for implementing ABC in small business. This procedure systematically provides the decision-maker with accurate cost information to establish corporate strategies, determine product cost, and improve the cost structure.
Stages of Activity Based Management (ABM):
ABC, by itself, is not enough for continuous improvement of the company. Activity Based Management (ABM) is a management philosophy that focuses on the planning, execution and measurement of activities and helps companies to survive in the competitive world of business. ABM allows leaders to examine non-value-added activities and make rational decisions to eliminate them. ABM relies on the ABC system to specify where non-value-added activities exist and to value the monetary benefits associated with their elimination. Management must institute a conscious process of organizational change and implementation if the organization is to receive benefits from the improved insights resulting from an ABC analysis.
Figure 2 illustrates the stages of ABM including monitoring, managing, and improving the performance of process.
Concrete is a primary material used in architecture and public work projects ranging in size from a single house to high-rise buildings. Concrete is a hardened building material created by combining a chemically inert mineral aggregate (usually sand, gravel, or crushed stone), a binder (natural or synthetic cement), chemical additives, and water. As concrete dries, it acquires a stone-like consistency that renders it ideal for constructing roads, bridges, water supply and sewage systems, factories, airports, railroads, waterways, mass transit systems, and other structures.
Concrete manufacturers expect their raw material suppliers to supply a consistent, uniform product. At the cement production factory, the proportions of the various raw materials that go into cement must be checked to achieve a consistent kiln feed, and samples of the mix are frequently examined using X-ray fluorescence analysis. The strength of concrete is probably the most important property that must be tested to comply with specifications. To achieve the desired strength, workers must carefully control the manufacturing process, which they normally do by using statistical process control.. Quality control charts are widely used by the suppliers of ready-mixed concrete and by the engineer on site to continually assess the strength of concrete. Other properties important for compliance include cement content, water/cement ratio, and workability, and standard test methods have been developed for these as well.
RMC is not only a product, it is a service, and each year about 20 million cubic meters of concrete are delivered in truck-mixers. The truck-mixers have developed since the late 1940s from a mobile site mixer into specialized vehicle capable of mixing, delivering and distributing concrete in a very economic manner. Indeed, in the viability of RMC depends on the efficient utilization of the specialized truck-mixer fleet. Although truck-mixer vehicles available in the range from 2 to 9 cubic meters capacity, the majority in use have a load capacity of 6 cubic meters of concrete. With “shelf life” of only a few hours, RMC is very much a local delivery service with an average distance from the depot to point of delivery of about 8 km.
Delivery cost, including the question of economy of scale, has been of interest to decision makers in different transportation sectors for many years. Managers need to have enough information about their cost to make the right decision about the type of services to provide and the prices to charge. There are many approaches to estimate the cost per km for trucks. Each of them employs a different methodology and models to calculate the variable cost of operating trucks. Fuel, repair and maintenance, tire, depreciation, and labor cost are the most important cost that is considered to estimate operating cost per km.
Operating cost depending on Activity Based Management (ABM):
AMG divided vehicle operating cost into two different categories, running cost and standing cost. Running cost includes fuel consumption, engine oil consumption, tire cost, and maintenance cost. Standing cost includes license, insurance, interest charges. AMG considered speed as the most important factor in fuel consumption and found maintenance cost rise with increasing speed. If fuel consumption and maintenance cost change, operating cost will change as well. Vehicle size is another factor that affects fuel consumption and it will change operating cost. By using average axle number for each firm we can include vehicle size in our model.
Here the costs are (according to Watanatada and Dhareshwar) divided the variables that affect the truck operating cost to the following categories: 1. Truck characteristics e.g., weight, engine power, and maintenance. 2. Local factors e.g., speed limit, fuel price, labor cost, and drivers’ attitude. 3. Road characteristics e.g., pavement roughness, and road width. Operating cost is considered a function of road characteristics and so is policy sensitive. AMG estimated operating cost for commercial trucks based on fuel, repair, maintenance, tires and depreciation cost. The authors also considered adjustment factors for cost, based on pavement roughness, driving conditions and fuel price changes. Moreover, they estimated the average truck operating cost per km at take 21 not including labor cost. For a labor cost of around take 16per km, the total operating cost using Barnes’ model adds up to take 39 per km. According to Hashami it is developed and tested a linear model in her thesis of Operating Cost for Commercial Vehicle Operators. Details of her contribution are presented in section 3.
Profile of the Organization
Introduction of Amin Mohammad Group:
Amin Mohammad Group is a market leader in the real estate building and development sector. It was started its journey in 1990. Every individual has a dream home in mind. We at Amin Mohammad Group are in the business of turning your dreams into reality. Over the part quarter century Amin Mohammad Group Luxury apartment and commercial buildings though developing lands in Dhaka city mostly located in Dhanmondi, Gulshan, Banani, Uttara, Mirpur, Motijhil, Ashulia, Chittagong , Cox’sBazar, & Sylhet have changed the Dhaka, Chittagong, & Sylhet skyline and presenteda new lifestyle.
Amin Mohammad Group is our environmentally responsible response to the rapid spateof urbanization in Bangladesh. Pressures of urbanization in this country are compounded by the unfavorable land man ration. Amin Mohammad Group has embarked upon amission to make the maximum use of minimum land being sensitive to bothenvironmental concerns and social continuity. Planned development by AminMohammad Group of the sites around the city has added value to those areas, released pressure on inner cities and persecuted the city dwellers with breathing space.
Professional team of design experts with mod outlook and engineers with state of the art equipment are backed by an R & D team constantly probing human habitat horizons as well as building technology. Their endeavors have resulted in the creation of an esthetically inspiring architecture, environmentally friendly development and top quality building. Amin Mohammad Group aim is to provide its clients with competitive price, quality materials, & hand over project on time. Amin Mohammad Group is the symbol of customer confidence.
Mission & vision of AMG:
AMG’s mission is both broad and focused. It builds on its vision and translates the essence of that vision into projects that respond to board category of needs. Each of AMG’s activities however is characterized by the same commitment to comfort and convenience. The mission of Amin Mohammad Group is to provide service at an economic cost & progress in diversity & continue to the growth of real estate sector in Bangladesh by being the real estate market challenger. The vision of Amin Mohammad Group is to offer unparallel service to create customer delight & enhance real estate business. Their vision is to achieve excellence & different sense of modern living style
Objectives of the Company:
To reach the goals of organization in individual aspects & the company as a whole.
Efficiency of the work force by employing their skills & abilities.
Providing employees with proper standards of job satisfaction.
Providing the organization with well trained & well motivated employees.
Communicate the policies to all employees of Human Resource Management issue.
The objective is to have a clear knowledge of planning, organization, leading &Controlling aspects of Amin Mohammad Group
Business Philosophy:
Profit Maximization
Cost Minimization
Company’s Wealth Maximization
Create customer value & satisfaction
The Organizational Structure:
The organ gram below depicts the organizational structure of Amin Mohammad Group
Chairman |
Managing Director |
Vice chairman |
The Deputy Managing Director |
Senior Executive Director |
| Director |
Operation Director |
Departments of the company:
In Amin Mohammad Group, Corporate Branch contains 7 major departments. The nameof those departments & activities are given below:
Reception Desk
Marketing & Sales Department
Administration & Business Department
Documentation & Recovery
Finance & Accounts Department
Procurement Department
Human Resources Management (HRM)
Reception Desk:
The main task at the reception desk is maintaining the inward & outward register, officemanagement, & telephone receiving. They also maintain a daily recall file which isknown as the Central Recall System
Marketing & Sales Department:
Amin Mohammad Group has a very rich marketing department. A strong sales team &aggressive marketing campaign has bought tremendous sales growth along with ahandsome market share.Amin Mohammad Group becomes a market leader in the real estate industry.
Administration & Business Department:
The administration department of Amin Mohammad Group always looks after the whole organization. They always run the organization smoothly. If any employee does any fault hen the department takes action against the employee. The company reward is given to the employee who has done well.
Finance & Accounts Department:
- Using Amin Mohammad Group (AMG) software.
- Final checking of Bank reconciliation.
- Checking of Bank Debtor order voucher.
- Checking the company financial accounts.
- Give clearance for surrender.
- Give clearance for registration
Procurement Department:
Buying Land.
Registration of the sold land
Documentation:
If any customer fails to pay the due in schedule time then this department arranges time extension latter & gives the time extension approval.
For business the client is not able to take deed in this case the officers of this department communicate with the client to take the deed by this time officers make a rough copy of the deed.
If any change his/her payment schedule or change the plot then this department arranges all procedure.
This department also make note sheet for registration when a client pay all the dues with registration fees.
Features of every projects of Amin MohammadGroup:
The project of Amin Mohammad Group are approved by RAJUK.
The locations of AMG is out of flood free zone.
The project has natural greeneries.
The Park & playground in every block separately.
School, College, & University are included in the project.
Amin Mohammad Group reserves 35% land for ecological balance.
The locations have eco-friendly environment. The administrative office & CCTV surveillance facility inside the project.
Police outpost, traffic system & fire service are available inside the location
Electricity, gas & water connection are available in site as committed.
Telephone & internet service are connected in the project.
Land is delivered according to the promised offered.
Registration is properly after full payment.
Amin Mohammad Group Location Map:
GroupSource: Official website of Amin Mohammad Group
Amin Mohammad Group’s Project:
| Name | Size | Location |
| Model Town | 2.5, 3, 5, 7.5, 10 20 katharesidential & | Manda, Motijhill, Dhaka. |
| Ashulia Abakash | 3-5 katha | Purba Sadarpur, Ashulia,Dhaka |
Ashulia Abakash2-5 kathaPurba Sadarpur, Ashulia,Dhaka.
Ashulia Kingdom2-5 kathaBara Rangamathi, Ashulia,Savar,Dhaka.Shyamol Chaya3 – 5 KathaPirerbazar, Sylhet
Amin Mohammad Group’s Upcoming Projects:
| Name | Size | Location |
| Dhaka South |
Dhaka South3 – 5 Katha
3 – 5 KathaKeranigong, Dhaka.
Keranigong, Dhaka.
Branches of Amin Mohammad Group:
Amin Mohammad Group has 7 decorated branches in Bangladesh.
Corporate Office: 752, Satmosjid road, Dhanmondi road, Dhaka-1025
Mitijhill Office: 29 Rajuk Avenue (2nd flore) Motijhill b/a, Dhaka.
Uttara Office: Green Aroma (2nd flore) bari-17 road- 7, sector- 4, uttara,Dhaka.
Chittagong office: 819/a Mehedibag, chittagong.
Sylhet Office: Rohim tower (3d flore), sobhani ghat
Green Model Town Site Office: Manda, Motijheel, Dhaka.Phone : 7271207
Ashulia Model Town Site Office: Ashulia Model Town, Ashulia, Saver, Dhaka.Phone : 7742169
Costing Model
Cost Model for RMC:
To estimate the cost of a demanded volume of RMC, it is necessary to cost required materials, labor involved, fuel and maintenance needed, plant and ancillary equipment hired and depreciated, and delivery of RMC to customer site. The proposed cost model subdivides the cost of RMC into three main cost categories including:
1) On-floor cost: the model utilizes a step-by-step ABC procedure from literature,
2) Cost of delivery: a new model for costing the delivery of RMC is proposed, and
3) Cost associated with riding RMC scrap: the model assigns cost to scrap based on the location where RMC got spoiled.
To illustrate, if RMC is spoiled in the factory, only on-floor cost will be charged. On the other hand, the sum of on-floor and delivery cost is charged if RMC is spoiled in its way to customer.
On-floor cost: The ABC model:
Figure 3 illustrates the proposed ABC model based on procedures for producing RMC and the related plant processes. A common procedure to identify cost activities is to interview people who work in overhead departments and ask them to describe their major activities. Activity centers are established such that all activities related to accomplishing a particular attribute are grouped. A good rule of thumb is not to have more than 20-25 activity centers for an ABC project. Table 1 presents RMC main in-plant activities and their cost centers.
For a typical RMC plant, Table 2 presents expense categories included in the income statement of the company. Moreover, the table presents the cost driver(s) of each category. Once the main expenses have been defined, a total cost of each expense can be found. Sample cost values are shown in Table 2 as obtained from the case study. This helps management and reengineering-teams efforts to minimizing expenses. Notice that equipment complexity is used as a cost driver for maintenance since more complex machines usually require more effort and time. The complexity of the machine may be measured by the number of components of the machine or the amount of technology contained in that machine. Miscellaneous costs (MC) are expenses that cannot be itemized or traced back to specific activities. Hence, miscellaneous cost are estimated or forecasted for the coming year (MCt+1) based on historical data and are divided equally over all overhead activities.
Table 1: Main activities and their cost centers.
Activities Cost centers
1. Electrical maintenance
2. Vehicle maintenance
3. Riding scrap
4. Equipment and plant maintenance
Maintenance center
5. Management
6. Guard work
7. Marketing and advertising
Administration center
8. Purchasing
9. General accounting Accounting center
10. Material receiving and shipping
11. Employee transportation
Transportation center 12. Weighing
13. Mixing Operation Preparation of raw material14. Quality Assurance Development center
Table 2: Expense categories, their cost drivers and yearly cost
| Expense category | Cost driver | Cost (tk/year) | |||
| Overhead Expenses: | |||||
| Salaries | Total labor salary per year | 122,93,760 | |||
| Overtime | Total labor overtime per year | 54,38,080 | |||
| Depreciation | 550Money use of resources | 10,84,000 | |||
| Office Expense | Level of use of office resources (%) | 2,92,400 | |||
| Utilities | Total cost per year | 1,44,000 | |||
| Transport | Distance (km) | 8,32,200 | |||
| Maintenance | Equipment complexity | 3,92,600 | |||
| Insurance | Cost of resource used by activity | 27,88,800 | |||
| Licenses | Type of licenses | 3,59,200 | |||
| Research and development | Cost of resource used by activity | 3,96,000 | |||
| Communication | Cost of resource used by activity | 8,28,320 | |||
| Miscellaneous | Total cost per year | 24,000 | |||
| Total | 2,48,73,360 | ||||
| Materials’ Cost : | |||||
| Portland Cement | Unit mass | 14,18,04,000 | |||
| Fine Aggregate | Unit mass | 2,11,75,200 | |||
| Coarse Aggregate | Unit mass | 21,86,000 | |||
| Water | Unit mass | 6,07,700 | |||
| Chemical Component | Unit mass | 71,28,000 | |||
| Total | 19,77,74,260 | ||||
Expense-Activity- Dependence (EAD) matrix:
To relate expenses to activities, an Expense-Activity- Dependence (EAD) matrix is established . To illustrate, the activities that contribute to each expense are identified and the EAD matrix is created. The expense categories represent the columns of the EAD matrix, whereas the activities represent the rows. If activity i contributes to the expense category j, a checkmark”√” is placed in the cell i, j. Follows, each expense category is traced back to activities and each expense category is divided among activities according to the proportion of contribution. The check marks in the EAD matrix are replaced by the proportions of contribution such that each column of the EAD matrix must add up to 1, implying that the entire expense category is spread across the activities.
Equation 1: presents the total cost TCA(i) of activity i where, j is the number of expense categories and EAD(і,j) is the entry і,j of the EAD matrix.
TCA(i)= ∑EDA(i,j) (1)
Equation 2: To obtain the overhead cost of a unit volume of an RMC product, the activities consumed by the product are identified and the Activity-Product-Dependence (APD) matrix is created. If product k (row entry) consumes the activity i (column entry), a check-mark is placed on the cell k,i. Follows, check marks in the APD matrix are replaced by the estimated proportions of consumption of product k from activity i such that each column of the APD matrix must add up to 1. These proportions are traced over the demand years and are assumed to be constant over the years. Equation 2 illustrates the overhead cost COkof a unit volume of product k where, N is Number of activities and APD(k, i) is the entry k, i of the APD matrix.
COk = ∑ TCA(i)× APD(k, i) (2)
Equation 3: On-floor cost (CFk) of a unit volume of product k is then computed by adding the cost of overhead activities to the cost of raw materials as illustrated in equation 3. Where, M is the number of materials’ types, umk is the amount of material m used to produce a unit volume of product k, and cm is the unit cost of material m. To estimate CFk for the coming year (t+1), overhead expenses and materials’ volumes and cost are to be foreseen based on expert opinion, regression models or time series analysis.
CFk = COk +∑ umk cm (3)
Delivery cost model:
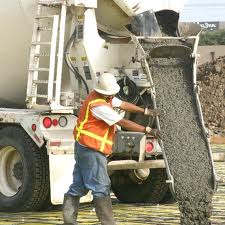
The RMC supply process can be divided into five major components including RMC production, product loading, transporting RMC to site, RMC placement, and truck return. The RMC production and placement activities must be connected by trucks to form an operation cycle. Since RMC is a perishable and un-storable material, it cannot be generated and stored in advance.
Major Components
Hence, time is critical when it comes to the delivery process of RMC because as time passes, the properties of fresh concrete change quickly, causing it to become unusable within few hours. If the truck travel time exceeds the cold-joint time (the time within which the concrete hardens), the concrete is rendered useless and must be dumped, which raises the operating cost. Therefore, to conform to quality and legislation requirements, RMC must be poured within a set time constraint. In practice, truck service is limited to a given region; the trucks must be carefully dispatched in order to prevent the cold joint process.
Consequently, RMC production scheduling and truck-dispatching not only affect transshipment efficiency, but also the operating cost. A number of limitations on the RMC must be taken into account before building a model for RMC delivery:
The materials are batched at a central plant, and the mixing begins at the plant, so the traveling time from the plant to the site is critical over longer distances.
Access roads and site access have to be able to carry the weight of the truck and load.
RMC should be placed within 2 hours of batching to avoid cold-joint. Concrete is still useable after this point but may not conform to the relevant specifications.
A minimum volume of RMC must be available in the truck during each trip.
Here a general linear model (Equation 4) is developed to obtain the total annual cost of delivery taking into accounts the correlations among the delivery variables. The model treats all customers equally, which means that near and far customers will pay the same amount of money.
Equation 4: Where: C: Total annual cost, O: 1 if the firm is the owner/operator, 0 otherwise, K: Overall travel distance in kilometers, T: Number of truckloads, P: 1 if firm is assessed a financial penalty for late delivery, 0 otherwise, H: 1 if the firm hauls more than one product, 0 otherwise, and B, B1, B2, B3, B4, and B5 are the associated cost.
C =B O + B1 (K/T) + B2 T + B3 P + B4 O + B5 H (4)
Equation 5: The paper presents a model for costing the delivery of RMC to the customer as a function of the travel distance and traffic conditions. To this end, the travel distance (l, in kilometers) is penalized by a factor (w ≥ 1) to account for traffic conditions. Equation 5 illustrates the cost of delivery (CTk) of a truck load of product k where, wh and wr are traffic factors for the hauling and return trip respectively, and ch and cr are the cost (tk/km) for the hauling and return trip respectively.
CTk = lh wh ch + lr wr cr (5)
Cost of riding RMC wastes:
Concrete waste is a material that is no longer valuable in its current state for its intended use and is either discarded or recycled. Reasons for RMC spoilage include failure to confirm to required RMC specifications, or delay during which cold-joint takes place.
Such delays are due plant break down, truck break down, or traffic conditions. Potential cost associated with spoilage management include the on-floor cost of wasted concrete (COk), and delivery cost to the location where spoilage took place (CTk); CTk = 0 if spoilage took place at the RMC plant.
Real time costing of product
Equation 6: illustrates the proposed costing model (CSt) of riding spoiled amounts of all RMC products during year t. In this paper, we use forecasting methods to predicate the spoilage amounts (VSkt+1) of product k for the coming year (t+1) based on historical data. The estimated spoilage cost per year (CSt+1) is then divided over the estimated volume of production for all RMC products (TDt+1) during that year to obtain the spoilage cost per unit volume. TDt+1are estimated using forecasting methods based on demand history.
CTkt+1 (Dk)=CFkt+1 Dk + CTkt+1 (Dk/c) +(CSt+1+CPt+1)(Dk/ TDt+1) (5)
Note that real time costing of product k is composed of 1. Estimated overhead cost, 2. Today’s cost of materials, 3. Today’s cost of delivery, 4. Estimated cost of spoiled RMC, and 5. Estimated cost of penalties. To compute the true cost of a product during a previous year, financial records are consulted to provide true expenses. Moreover, true demands replace estimated ones.
CSt=∑ (CFk+ CTk)VSkt (6)
Penalties for late deliveries and volume discounts:
The cost associated with delayed concrete deliveries (CP) cannot be itemized or traced back to specific activities. Hence, CP cost are estimated or forecasted for the coming year and are divided over TDt+1 to obtain the related cost per unit volume. On the other hand, volume discounts are traceable cost and are part of the marketing policy of the company. Volume discounts may take various formats including fixed discount per order, percentage discounts based on volume, and rough discounts based on negotiations with the customer. To this end, the proposed model does not include volume discounts and leaves the room to company on deciding the amount of discount on an order as a reduction from its profit.
Total cost of RMC:
Equation 7: Presents the total cost (Ckt+1) for producing and transporting Dk unit volumes of RMC product k for the year t+1. Where, c is the capacity of the truck, and (Dk/c) number of required truck loads, is the nearest integer greater than or equal to (Dk/c).
Design of the Right Concrete Mix:
Using the perspective method, here is an abbreviated run-through on how to design a mix:
- Choose the target slump
- Choose the maximum aggregate size—remember that the larger the better for reducing shrinkage and curling.
- Estimate the water and air content using.
- Select the water-cement ratio.
- Calculate the cement content by dividing the water content by the water-cement ratio.
- Estimate the coarse aggregate content.
- Estimate the fine aggregate content.
- Adjust for aggregate moisture—wet aggregate can significantly reduce the amount of water to be added.
- Make trial batches to see what you’ve got.
Concrete is tested for strength by breaking cylinders.
So you see that after all these fancy calculations, the bottom line is that concrete is still designed by experience with previous mixes or by making trial batches in the lab and testing the concrete. Nothing beats experience with a mix. Many decorative contractors will have 4 or 5 mixes that they use for different applications or weather conditions. If you have these mixes already in your ready mix provider’s office, he can quickly pull out the design and you can tell him to bring your mix.
Application of the Costing Model
Model Verification:
To verify the usability of the model, we implement the proposed costing model on a local RMC plant and results are compared to that obtained using the traditional costing model of the company. To identify and classify activities, trace expenses to activities, and trace activities’ cost to products, departments in the RMC plant are visited, employees are interviewed, and organization chart is studied.
The main identified activities include maintenance (electrical, cars and bulldozer, equipments and plant), management, purchasing, general accounting, receiving, employee transportation, weighing, mixing, quality assurance, waste management (riding scrap), and guard work (plant equipment and inventory). A thorough investigation of related expenses show that expenses of the activities can be categorized into salaries, overtime, office, communication, research and development, insurance, licensing, fuel and oil, raw materials, water and electricity, and miscellanies.
To obtain the on-floor cost of products, we track expenses of the company to products through expense categories and related activities. Table 2 illustrates expense categories and their cost. Expense categories are related to activities as shown in the EAD Matrix, Table 3. Dollar values for activity-expense intersection and total cost per activity are shown in Table 4.
Activity-Product Dependence (APD) matrix in practical:
To cost the various products, P150, P200, P250, P300, and P350, of the company for 2012, the activities consumed by each product are identified and the Activity-Product Dependence (APD) matrix is created. It is noticed that the only difference between these products is the percentage of raw materials consumed by the product. Hence, the dollar expense of a product type k from a certain activity, excluding materials, equals the relative yearly demand of that product type (Dk/TD) multiplied by that expense.
To illustrate, the relative demands of P150, P200, P250, P300, and P350 are 20%, 50%, 20%, 10%, and 0% respectively. Therefore, the tk33,96,306 of electrical maintenance, see Table 4 and 5, is subdivided among P150, P200, P250, and P300 as tk6,79,260, tk16,98,150, tk6,79,260, and tk3,39,630 respectively. Therefore, the overhead cost per unit volume of each product (CO) equals tk42.65
Table 5 presents the yearly demands and materials consumption for the four products. Table 6 presents estimated and traditional cost per cubic meter of materials of the company’s RMC products. The traditional on-floor costing method of the company takes into account today’s materials’ cost and adds a flat overhead cost of tk48.00. Where, the unit cost of a material is obtained by dividing the total cost of that material over the total amount of material used to produce all product types over the year.
Table 5: Yearly demand and consumption of materials for RMC products.
| Products | Yearly Demand |
(m³)
Cement
(kg/m³)
Fine Aggregate
(kg/m³)
Coarse Aggregate
(kg/m³)
Water
(Lit/m3)
Chemical Component
(Lit/m3) P15018,000 235 605 593 215 4.5P20045,000 300 585 574 215 5P25018,000 360 570 559 215 5P3009,000 340 607 679 202 5.5
To illustrate, the total weight of coarse aggregate used to produce the 90,000m3 of RMC products equals 52,677,000 (18,000 × 593 + 45,000 × 574 + 18,000 × 559 + 9,000 × 679) kilograms. Hence, the average unit cost of coarse aggregate equals the per-year cost of coarse aggregate (take 2,10,70,800) divided by the total weight of the material used during the year. This yields a unit cost of tk0.40 per kilogram of coarse aggregate. Note that P250 cost more than P300 although it is offered to customers at a lower price. Obtained results illustrate that the RMC company over estimated their yearly production cost by more than tk19,20,000 since no scraped mixes or penalties were reported over that year. On the other hand, a scrap level of more than 0.8% (about 720m3) of RMC mixes at the average price of taka 2341.5 may justify the difference.
Table 6: On-Floor Cost per m3 of RMC products.
| Products | Proposed | Traditional | ||||||||||||||
| Materials | Overhead | On-Floor | Materials | Overhead | On-Floor | |||||||||||
| P150 | 1807.60 | 42.65 | 1850.25 | 1807.6 | 48.00 | 1855.6 0 | ||||||||||
| P200 | 2138.00 | 42.65 | 2180.65 | 2138.0 | 48.00 | 2186.00 | ||||||||||
| P250 | 2438.00 | 42.65 | 4280.65 | 2438.0 | 48.00 | 2486.00 | ||||||||||
| P300 | 2402.72 | 42.65 | 2445.37 | 2402.7 | 48.00 | 240.72 | ||||||||||
For delivery operations, the company limits their maximum reach to customers’ sites within an 80km radius to prevent cold joint. Deliveries are made using mixing trucks with a maximum capacity of 9m3. Customers within the circle of 20km are charged take 480 per trip. Beyond the 20km limit, the customer is charged an extra take 20 – 24 per kilometer per trip depending on traffic conditions. For the purpose of this research, company experts estimated a markup percentage of 35% to estimate traditional delivery cost. Moreover, they estimated the cost for hauling and returning at take 14 and take 10 per kilometer per trip, respectively. Furthermore, they estimated the impact of traffic at wh = 100 and wr = 92.
Delivery charges:
Table 7 illustrates examples of the delivery charges of volumes of RMC to various customers’ locations in hundred. Note that the traditional system is not sensitive to distances within the 20km limit. Moreover, note that while the company over estimates their delivery costs for various scenarios, they largely under estimate it for the rest of the scenarios especially for long distance deliveries. Summing up on-floor and delivery cost yields the total cost of RMC products. Figure 4 shows the difference in total cost (Traditional – Proposed) per cubic meter of RMC for various combinations of demand, distance, and traffic conditions. Where, 5, 9, 12, 25, and 45 represent delivery volumes, and NT stands for “no traffic” and WT for “with traffic” conditions.
Table 7: Traditional vs. proposed delivery costing systems. (shown in hundred)
Differences between traditional and proposed costing systems:
To stay competitive, companies put efforts to reduce their expenses through the better management of their resources. Improvement efforts should take into account the value that the process/activity contributes to the final product. Hence, activities with no added value should be eliminated. Moreover, efforts should focus on simplifying value-added activities to save time, effort, and cost. The expense categories and their cost shown in Table 2 show that raw materials contribute to the maximum percentage of expenses and cannot be changed because of specifications.
Hence, improvement efforts should focus on 1. Improving work schedules to reduce overtime, 2. Adapt preventive and predictive maintenance to ensure optimum levels of availability, enhance the performance of machines and vehicles, and decrease the rate of depreciation, and 3. Improve the costing practices adapted in the company.
Findings, Conclusions & Recommendation
Findings:
Yearly demands and materials consumption.
A thorough investigation of related expenses show that expenses of the activities can be categorized into salaries, overtime, office, communication, research and development, insurance, licensing, fuel and oil, raw materials, water and electricity, and miscellanies
Proper way of choice of the maximum aggregate size remembering that the larger the better for reducing shrinkage and curling.
Estimate the coarse aggregate content
How the complexity of the machine can be measured by the number of components of the machine or the amount of technology contained in that machine.
Recommendations:
Improvement efforts should focus on.
They should enhance the performance of machines and vehicles, and decrease the rate of depreciation.
Company put efforts to reduce their expenses through the better management of their resources.
Equipment complexity of cost driver should be diminished by properly develop the model.
Conclusions:
The paper presents a model for costing RMC based on the type of mix and customer’s information. The model divides the cost into on-floor, delivery, waste riding, and penalties related cost. The model utilizes ABC to identify activities and assign cost of resources products according to the actual consumption of each product from recourses.
ABC helps management arrive at the true cost of a product to avoid under or over costing. Moreover, the analysis of expense categories and their cost help management set their improvement priorities. The model accounts for product and vehicle constraints including expected life of the mix during transportation and the capacity of the vehicle.
The proposed model is applied at a local RMC company where cost differences were recognized compared to the current costing model of the company. While on-floor and scrap management cost are similar and depend only on demand volumes and product type, delivery cost take into account distance and traffic conditions to customer location.
This helps management distinguish among customers in charging delivery cost. Although materials account for the largest percentage of expenses, RMC management should investigate potentials to reduce or eliminate some elements for each expense. Among the many, savings associated with depreciation and maintenance can be easily obtained through applying maintenance best practices.
Biblography:
- Grandlich, C., 2004, Using Activity-Based Costing in Surgery. AORN, 79(1)
- Roberts, M., and Silvester, K., 1996, Why ABC Failed and How It May Yet Succeed?. Journal of Cost Management, 9.
- Gunasekaran A., McNeil, R., and Singh, D., 2000, Activity –Based Management in a Small Company: A Case Study. Production Planning and Control, 11.
- Mindess, S., Young, J., and Darwin, D., 2003, Concrete, 2nd Edition. Prentice-Hall Inc., Upper Saddle River, NJ.
- Tommelein, I., and Li A., 1999, Just-in-time concrete delivery: mapping alternatives for vertical supply chain integration. University of California, Berkeley.
- Schmid, V., 2007, Trucks in movement: hybridization of exact approaches and variable neighborhood search for the delivery of ready-mixed concrete. PhD thesis, University of Vienna.
- Braeutigam, R., 1999, Learning about Transport Cost, Essay in Transportation Economics and Policy. Brooking Institution Press, Washington, D.C.
- AMG, C., 1974, Vehicle operating cost in transport studies: With special reference to the work of the EIU in Africa. Economist Intelligence Unit, London.
- Watanatada, T., and Dhareshwar, A., 1987, Vehicles Speeds and Operating Cost, Washington, D.C., The World Bank.
- Barnes, G., and Langworthy, P., 2003, The Per-Mile Cost of Operating Automobiles and Trucks. Forthcoming report, Minnesota Department of Transportation.
- Hashami, M., 2004, Operating Cost for Commercial Vehicle Operators in Minnesota, Spring.
- Cooper, R., and Kaplan, R., 1988, Measure Cost Right: Make the Right Decisions. Harvard Business Review.
- O’Guin, M., 1991, The Complete Guide to Activity-Based Costing. Prentice Hall, NJ.
- Cooper, R., 1987, Does Your Company Need a New Cost System?. Journal of Cost Management. 6(3).
- Holmen, J., 1995, ABC vs. TOC: It’s a Matter of Time. Management Accounting.
- Nachtmann, H., and Al-Reifai, M, 2004, An Application of Activity Based Costing in the Air Conditioner Manufacturing Industry. The Engineering Economist, 49
- Jeff Madura & Thomson (2003) “International Finance Management”, (8th Edition) USA.
- Garrison and Noreen & Irwin McGraw-Hill (2003) “Managerial Accounting”, (13th Edition), New York, John Wiley & Sons, Inc.