Introduction:
The balance of payments is a statistical statement that provides a systematic summary of economic transactions of an economy with the rest of the world, for a specific time period. The transactions are for the most part between residents and non-residents of the economy. The transactions included comprise: goods, services, and income; those involving financial claims on and liabilities to the rest of the world; and transfers. A transaction is defined as an economic flow that reflects the creation, transformation, exchange, transfer, or extinction of economic value and involves changes in ownership, of goods or assets, the provision of services, labor or capital.
Balance of payments data are compiled in accordance with the 5th edition of the Balance of Payments Manual published by the IMF (BPM5), and presented according to the Standard Presentation.
Balance of payments statistics are used as a key economic indicator due to the close relationship between domestic economic and external developments. This relationship has strengthened over the last two decades with the growing interdependence of the world’s economies. Balance of payments and related trade and financial statistics are used by agencies responsible for the formulation of policy on issues such as causes of payments imbalances, adjustment measures, and merchandise trade; trade in services, financial flows, financial stability and foreign direct investment, etc.
In principle as part of a double entry accounting system the balance of payments should balance, but as the components are independently derived from (many) different sources, they do not in practice balance. The residual imbalance is described by the term “net errors and omissions”.
Indonesia, officially the Republic of Indonesia, is a country in Southeast Asia and Oceania. Indonesia comprises 17,508 islands and thirty three provinces. With over 238 million people, it is the world’s fourth most populous country, and has the world’s largest population of Muslims. Indonesia is a republic, with an elected legislature and president. The nation’s capital city is Jakarta. The country shares land borders with Papua New Guinea, East Timor, and Malaysia. Other neighboring countries include Singapore, Philippines, Australia, and the Indian territory of the Andaman and Nicobar Islands. Indonesia is a founding member of ASEAN and a member of the G-20 major economies. The Indonesian economy is the world’s eighteenth largest economy by nominal GDP and fifteenth largest by purchasing power parity.
The Indonesian archipelago has been an important trade region since at least the 7th century, when Srivijaya and then later Majapahit traded with China and India. Local rulers gradually absorbed foreign cultural, religious and political models from the early centuries CE, and Hindu and Buddhist kingdoms flourished. Indonesian history has been influenced by foreign powers drawn to its natural resources. Muslim traders brought Islam, and European powers brought Christianity and fought one another to monopolize trade in the Spice Islands of Maluku during the Age of Discovery. Following three and a half centuries of Dutch colonialism, Indonesia secured its independence after World War II. Indonesia’s history has since been turbulent, with challenges posed by natural disasters, corruption, separatism, a democratization process, and periods of rapid economic change.
Across its many islands, Indonesia consists of distinct ethnic, linguistic, and religious groups. The Javanese are the largest—and the politically dominant—ethnic group. Indonesia has developed a shared identity defined by a national language, ethnic diversity, religious pluralism within a majority Muslim population, and a history of colonialism including rebellion against it. Indonesia’s national motto, “Bhinneka Tunggal Ika” (“Unity in Diversity” literally, “many, yet one”), articulates the diversity that shapes the country. Despite its large population and densely populated regions, Indonesia has vast areas of wilderness that support the world’s second highest level of biodiversity. The country is richly endowed with natural resources, yet poverty remains widespread in contemporary Indonesia.
Indonesia Balance of Payments
Name of collection/source
The data are derived from a combination of customs declarations, administrative records and surveys, and cover the entire economy.
Direct source
International Monetary Fund
Source Periodicity
Periodicity: Quarterly Timeliness: 3 months after the end of the reference quarter.
Geographic coverage
The geographic coverage corresponds to the national boundaries of Indonesia including Indonesia’s embassies abroad and excluding foreign embassies in Indonesia.
Concepts & Classifications
Key statistical concept
Indonesia Balance of Payments
The agency responsible for compiling Indonesia’s balance of payments is Bank Indonesia (BI). BI obtains primary data from a variety of sources, including customs data, an international transaction reporting system (ITRS), administrative data from the ministries and other government agencies, and surveys of banks and private sector enterprises. Data are prepared on a quarterly basis and are published in the monthly bulletin Indonesia Financial Statistics, the Quarterly Review, and in the Annual Report of BI. Transactions denominated in other currencies are converted to U.S. dollar equivalents at the exchange rate prevailing on the transaction dates or the average exchange rate for the period. The balance of payments compilation is in principle in accordance with the concepts set out in the BPM5. To take a view on the current BOP the accounts are shown in the appendix.
Current Account Balance
Current Account Goods
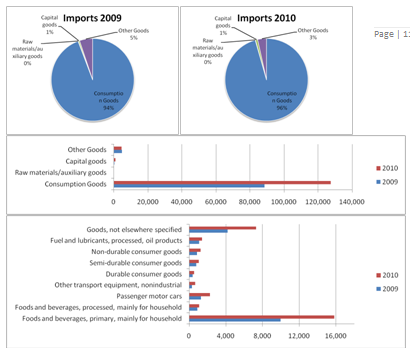
Data on goods consist of general merchandise and nonmonetary gold. Data on exports and imports are compiled by the BI on the basis of customs documents and other sources. Goods exported and imported are valued in the customs documents on an f.o.b. and c.i.f. basis, respectively. Imports are converted to an f.o.b. basis by subtracting freight on imports.
Non-oil
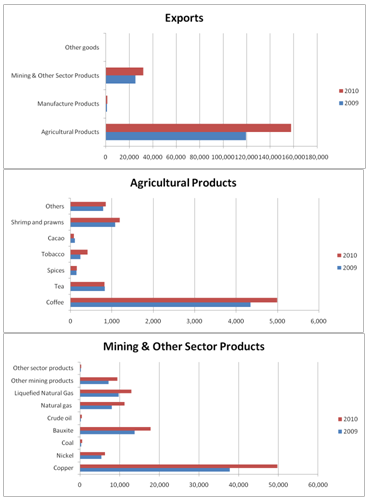
Non-oil goodes includes agricultural products like coffee, tea, spices, tobacco, cacao, shrims and prawns etc. Manufacturing products involves textiles and textile products, processed wood products, chemicals, metal products, electric appliances, cement, paper, rubber products etc. Mining products like copper, nickel, coal, boaxite etc.
Oil
Palm oli, Liqiufied petrolium gas, crude oil etc.
Gas
Liquified natural gas
Services
Transportation
This category covers freight, passenger, and other by all modes of transport. Entries for the value of freight debits are mainly estimated on the basis of information on freight furnished in customs declaration forms. The data on passenger service credits and freight credits are collected from ITRS. Data on passenger transportation debits are estimated based on a survey of travelers and average air fares derived from a survey of travel agencies. Other transportation includes foreign exchange receipts for use of seaport and airport facilities. These data are reported by the seaport and airport authorities.
Travel
Entries for travel credits and debits are derived from census and surveys conducted by the Ministry of Tourism and the Central Bureau of Statistics. Estimates are made by combining the number of foreign visitors and the number of Indonesian travelers abroad with estimation of their average expenditures. Entries for travel debits are derived from information provided by other ministries. It should be noted that part of the travel debit item is accounted for by hajj pilgrimages.
Other services
Communications.
Data cover telecommunications, postal, and courier services, which are obtained from ITRS.
Construction.
Data cover construction and installation projects that have been done either abroad or in the compiling economy. The data are obtained from the ITRS.
Insurance.
This category covers freight insurance and reinsurance. Data are compiled on the basis of information from the customs documents and from the annual reports of insurance companies and ITRS.
Financial.
Data include commissions and fees of financial intermediation. The data are obtained from the ITRS.
Computer and information.
Data cover hardware consultancy, software implementation, maintenance and repair of computers, and information services, including data processing and news agency services. The data are obtained from the ITRS.
Royalties and license fees.
Data cover receipts and payments for the use of trademarks, copyrights, patents, processes, franchise, etc. The data are obtained from the ITRS.
Other business services.
Data cover miscellaneous business, professional, and technical services, etc. The data are obtained from the ITRS.
Personal, cultural, and recreational.
Data include services associated with the production of motion pictures on films or video tape, radio, and television programs, and musical recordings, etc. The data are obtained from the ITRS.
Government, n.i.e.
Data on these transactions are derived from information provided by relevant ministries, as well as international organizations. The credit entries include expenditures of foreign embassies, foreign diplomatic missions, international organizations in Indonesia, nontax revenue of Indonesia’s embassies, and visa on arrival (VOA). The debit entries cover the expenditures abroad of Indonesian embassies.
Income
Investment income
Direct investment.
Data on direct investment income are estimated on the basis of reports on external debt, submitted by foreign direct investment enterprises.
Portfolio investment.
Data on portfolio investment income are derived from the accounting records of BI.
Other investment.
Data on other investment income are derived from the Ministry of Finance data on the external debt of the government, other sectors’ external debt data compiled by BI, and the monetary statistics.
Current transfers
General government
Data are derived from information provided by the Ministry of Finance and National Development Planning Agency. The entries include grants in cash and in kind received for development, including technical assistance.
Other sectors
The entries for this item consist of data on worker’s remittances and other current transfers such as premiums (minus service charges) and claims for non-life insurance and reinsurance. The data on worker’s remittance debits are derived from the relevant ministry’s reports on the number of Indonesian workers abroad and their average wages and salaries. The data on worker’s remittance credits are derived from relevant ministry’s reports on the number of foreign workers and their average wages and salaries.
Capital and Financial Accounts
Capital Account
Capital transfers
It is not yet possible to break down unrequited transfers into current transfers and capital transfers, and all such transfers are classified under current transfers.
Financial Account
Direct investment
Data on direct investment in Indonesia consist of equity capital and other capital. Data on equity are derived from the survey results, and data on other capital are obtained from foreign debt report of enterprises.
Portfolio investment
This component covers inward portfolio investment data on equity securities traded on the Jakarta Stock Exchange, and debt securities. The data on debt securities, including bonds, notes, and money market instruments, are obtained from the BI and custodian banks’ reports. In addition, domestic and international publications are used to monitor the issuance of debt securities of Indonesian enterprises in the international market.
Other investment
Other investment entries consist of drawings and repayments of loans received by residents. These data are obtained from the BI external debt statistics.
Reserve assets
Data are derived from the accounting records of BI and include changes in foreign exchange holdings of BI. These changes are estimated as differences in amounts outstanding and therefore include valuation changes. Starting from the first quarter 2004, the reserve asset component covers only transaction data and excludes the valuation changes.
The particulars of the BOP
BOP Summary (see appendix table 1)
Over all balance has increased from 12.5 billion to 30 billion. The current account balance is positive in 2009 and 2010 though the balance is decreased in 2010 by 5 billion from 10 billon USD.
- The goods account has been positive in both 2009 and 2010 is at 30 billion USD level. Non-oil & gas sector has been good and positive over the years but in oil sector the BOP is negative over the years.
- Services Account got negative balance in both the financial years and of about 9 billion USD.
- Income account shows negative balance over the years and has in creased to 20 billion from 15 billion of previous year.
- Current Transfers got positive balance of about 4 billion over the years.
Capital and financial account balance has increased by big margin in the year 2010 from 2009. From around 5 billion to 26 billion.
- Capital Account balance is positive but not significant only 100m & 50m in 2009 & 2010.
- Financial account has robust growth. Grown to 26 billion from 4 billion. And is the most dominating part of Capital and financial account.
(in million USD) | 2009 | 2010 |
FDI | 2,628 | 10,639 |
Portfolio | 10,336 | 13,202 |
Other | -8,208 | 2,243 |
So from this we get a view here is that some factor has contributed to the current strength of BOP. We’ll come back to that later on. In 2010 for all quarters the growth rate of current account items has been positive. (Appendix Table 2). So it seems the better looks in BOP is due to the capital account.
So the good balance is due to the rupiah appreciation, otherwise the BOP of Indonesia is decreasing.
EXPORTS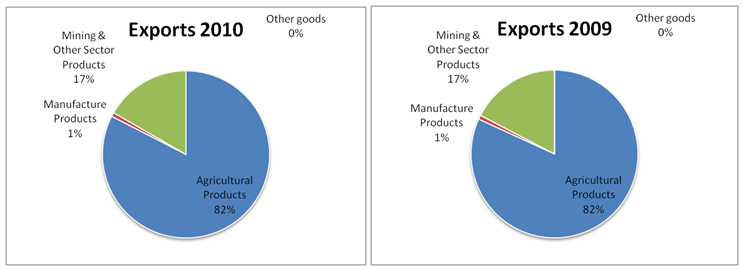
Indonesia: The present balance of payments current outlook [2]
Indonesia’s balance of payments position has been strengthening since 2Q09 when the global economic recovery began. The BOP surplus in 2Q09-4Q10 reached USD 39bn, even more than the USD 30bn accumulated in the five years prior to global financial crisis during 2004-2008. Foreign reserves have climbed above the USD 100bn mark to hit a record high of USD 105.7bn as of March 2011.
During the past 24 months, foreign reserves rose cumulatively by USD 51bn, equivalent to a rise of USD 2bn per month (Chart 2).
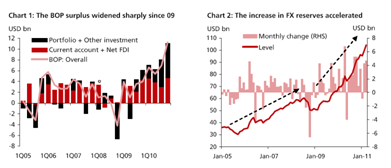
Taking a closer look at the BOP components, we found that stable inflows from the current account and foreign direct investment contributed to 60% of the BOP surplus from 2Q09 to 4Q10 (Chart 1). Portfolio and other investment, which are volatile in nature, accounted for the remaining 40%.
If we consider the change in the BOP compared to the periods before global crisis, however, the increase in BOP surplus starting from 2Q09 was primarily due to an increase in portfolio and other investment (about 70%). This was supported by a favorable global backdrop in terms of liquidity and risk appetite.
Outlook: Current account
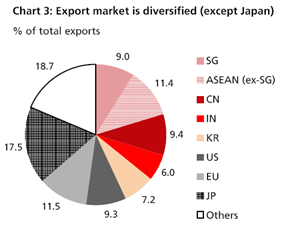
Going forward, they are maintaining current account forecast at USD 5bn for this year, compared to USD 6bn in 2010. Indonesia’s exports are diversified in terms of the market exposure.
Except for Japan (17.5% of total exports), US, EU, China, Singapore and ex-SG ASEAN markets equally account for about 10% of Indonesia’s overall exports (Chart 3). To be sure, trade flows will be disrupted by Japan’s earthquake/nuclear disasters in March and 2Q. Indonesia’s statistics agency has said on April 2 that the country’s exports to Japan contracted by -25% MoM in March, lowering exports by USD 0.4bn. However, this disruption is likely to be short-lived as Indonesia’s commodity-based exports would benefit from Japan’s reconstruction efforts later this year.
 As such, the non-energy trade balance remains in a steady surplus as non-oil and gas imports are rising in line with non-oil and gas exports and are likely to remain so (Chart 4). There are also no obvious signs of overheating in the domestic economy that might push the balance into deficit territory. Bank loan growth has slightly exceeded nominal GDP growth
to reach 23% YoY, but is much lower than the over 30% growth rate seen in 2008. Headline inflation is above the central bank’s target ceiling of 6%, but core inflation is well-capped.
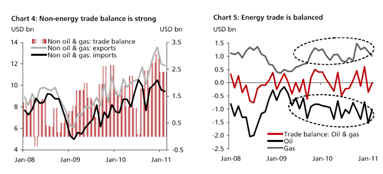
Meanwhile, Indonesia is a net importer of oil (crude oil combined with refined fuel products), but a net exporter of natural gas, the prices of which are highly correlated with oil prices. Thus, changes in oil prices also do not alter the overall trade balance position (Chart 5).
FDI
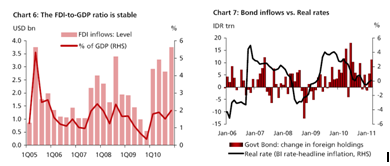
FDI inflows also appear likely to remain steady ahead as a percentage of GDP (Chart 6). Assuming the FDI-to-GDP ratio is unchanged at the pre-crisis level of 2%; gross FDI inflows are expected to reach USD 17bn this year, compared to USD 13bn in 2010.
As the cyclical recovery in the global economy appears unlikely to be derailed by the MENA crisis and Japan earthquake, business expansion by multinational companies should continue. While Japanese firms may postpone some investment plans in Indonesia due to a greater demand for capital for reconstruction efforts, the overall global growth outlook and hence FDI outlook are not affected by the natural disasters in Japan.
Structural forces too point to a rise in FDI ahead. The deterioration in the long-term growth outlook in advanced economies should push MNCs to expand in emerging markets that have stronger growth prospects. Further, the chronic wage pressures in China would persuade MNCs in the labor intensive sectors to move to lower-cost investment destinations. Indonesia is attractive both in terms of the growth potential and labor costs, thanks to favorable demographic trends.
That said, FDI investment will continue to be curtailed by the usual hurdles to doing business in Indonesia, including weak infrastructure, labor market rigidities and uncertainties in the legal framework. Reforms to reduce these barriers are not rapid and expecting immediate results will not be realistic.
Portfolio investment
Portfolio investment in Indonesia is mainly comprised of foreign investment in debt securities (government bonds and central bank certificates). These investments will be sensitive to interest rates and inflation dynamics in Indonesia, aside from the liquidity conditions and risk appetite in global markets.
Currently headline CPI inflation is slowing (6.7% YoY in Mar, down from the peak of 7.0% in Jan) and rate hike expectations are being tempered. This is because food prices are retreating alongside the arrival of domestic harvest season, and the government is maintaining fuel subsidies and has postponed a plan to deregulate fuel prices for private car users (originally scheduled in April for Greater Jakarta). Excluding food and oil, core inflation has still risen gradually to 4.5% in March from 4.2% in January, on track to reach our forecast of 5% by the year-end.
In Indonesia it is the monthly data of headline inflation that is widely tracked by investors and targeted by Bank Indonesia in setting monetary policy. While the near-term pressures on headline inflation seem to be easing (2Q), the uncertainties related to impacts from oil and food prices will remain high in 2H. Pressures will stem from fuel price deregulation, which is being postponed for now.
Although subsidizing fuels will not lead to severe fiscal stress for Indonesia, it causes price distortions, misallocation of resources and economic inefficiency. As such, the government has committed to completely end the use of subsidized fuels by private cars across the country by 2013. We estimate that the fuel price deregulation in Greater Jakarta will boost inflation (MoM) by 0.8ppt, should international oil prices stay at the Feb-Mar levels of USD 100-110/bbl. The longer the deregulation is delayed, the greater the inflationary impact would be, if global oil prices continue the upward trend ahead.
Food prices may also face renewed uncertainties in 2H, as the rice harvest period will end by then and the demand-side pressures on food prices will likely resurface. International food prices may also go up if oil prices continue to rise, due to the substitution between bio-fuels and oil.
Thus, rate expectations and (consequently) portfolio capital flows would still experience volatility later this year on oil and food prices. The key positive to note here is that Indonesia’s sovereign credit profile has improved on the back of improving public finances. This lowers the risk premium on debt securities assets, bolsters investor confidence and will help reduce the volatility in portfolio flows over time. Currently all the three mainstream rating agencies place Indonesia at only one notch below the investment grade, and both S&P and Fitch have assigned a “positive” outlook for the ratings.
Strengthening Export and Investment amid Uneven Global Economic Recovery
Continuing growth of exports and investment amid uneven global economic recovery has become the major driver of economic growth in 2010. From structural point of view, the role of natural resource based of exporting commodities was strengthened significantly. These commodities were the major contributor to the 2010 exports growth which was anchored by the rise in demand for and prices of those commodities in international markets. The role of exports to the economy, however, should be improved in many ways, for example by improving the competitiveness, mainly in manufactured export commodities, to support the resilience of Indonesia’s balance of payments. Meanwhile, investment performance in supporting the increasing production capacity is also needed to promote sustainable economic growth without creating inflationary pressures. The role of investment to support the increased competitiveness of manufactured exports is also inevitable, which then requires necessary resolution for some major hindering factors on investment growth.
The improved Indonesia’s exports in 2010 were supported mainly by high demand of natural resource -based of exporting commodities and the surge in global commodity prices. Several factors however also supported the increase in exports, such as more diverse of exporting commodities and less dependent to developed countries’ markets following the growing role of emerging countries’ markets as Indonesia’s export destination. Furthermore, the rise in demand for and prices of commodity in 2010 compensated the impact of rupiah appreciation against exports. However, given that the export structure was more dominated by natural resources based commodities which tend to have a lower value added and also limited in stock to response the increased demand, efforts to support the export will also needed to include the development of high value added yet sustainable products.
The increased of investment in 2010 was in line with the rise of domestic and global economic activities. Buoyant consumption and exports which were dominant during 2010 eventually has encouraged a higher investment growth. The confidence of both domestic and foreign economic players on the Indonesian economy continued to increase and thus encouraged an improvement in investment financing.


