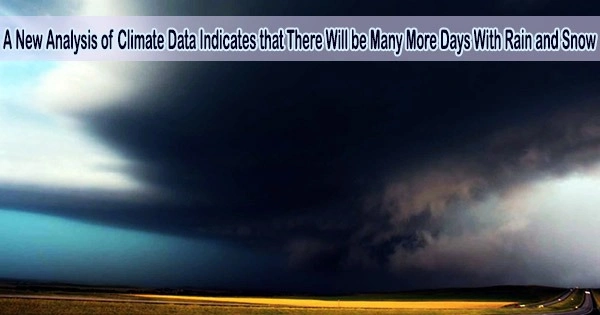
According to a major source of data used to support the next National Climate Assessment, Americans may soon experience heavy precipitation days more frequently than they do now, more than once every century.
By the end of this century, the Pacific Northwest and the southeastern United States could experience extremely intense days of rain or snow more frequently than previously anticipated, according to researchers at the Scripps Institution of Oceanography at UC San Diego and the Department of Energy’s Lawrence Berkeley National Laboratory (Berkeley Lab). This could happen as frequently as once every 30 or 40 years.
The conclusions come from analyzing a 30-terabyte data set that models temperature and precipitation at scales roughly the size of urban ZIP codes: six kilometers (3.9 miles). Researchers to offer local planners climatic data that is helpful created the Localized Constructed Analogs Version 2 (LOCA2) data set. In contrast, the majority of the current, sophisticated climate models focus on areas between 50 and 250 kilometers (30 and 400 miles) in size.
“With this data set, we’re able to look at the impacts of actual weather pattern changes across the United States at an extremely granular level,” said Dan Feldman, staff scientist at Berkeley Lab and the project’s principal investigator. “We see that there is a lot more extreme weather that is likely to happen in the future and by looking at actual weather patterns, we show that changes in extreme precipitation will actually be more extreme than previously estimated. Land use managers and planners should expect more extremes, but location matters.”
The LOCA2 data set updates a similar analysis conducted in 2016 in advance of the Fourth National Climate Assessment (NCA), which was released in 2018 by the U.S. Global Change Research Program.
This research translates that bigger picture into more practical data for infrastructure and operations planning. With this more detailed look at local impacts, we can help local officials make better-informed decisions, such as how long to make an airport runway, how much resilience to include for constructing buildings or bridges, or where to put crops or culverts.
Dan Feldman
The NCA is designed to help the U.S. government prepare for, mitigate against, and adapt to climate changes that will impact the nation. The Fifth NCA is expected to be issued later this year.
LOCA2 projections cover the lower 48 states of the United States, southern Canada, and northern Mexico. The data set includes 27 updated climate models from the Coupled Model Intercomparison Project (CMIP6), the most recent iteration of a global effort to simulate climate that includes the “coupling” of natural systems like the ocean and atmosphere to understand how they will act in concert as climate changes. The data set is based on more than 70 years of weather data.
“We’ve spent a lot of effort improving the representation of extreme wet days, which is important for understanding both the likelihood of flooding and the availability of water for agricultural, commercial, and residential use,” said David Pierce, a scientist at Scripps Oceanography and the developer of LOCA and LOCA2.
The LOCA2 climate estimates are available for three distinct greenhouse gas emission scenarios known as SSPs, or Shared Socioeconomic Pathways, through the end of the century and down to the daily level.
The three scenarios are a medium level of emissions that is slightly less than current levels (SSP 245), medium-high (SSP 370), and high, where emissions greatly increase (SSP 585). The data set is freely available for planners and decision makers to use.
The projection reinforces what climate scientists have long predicted: Future weather events will become more extreme in a warming world. LOCA2 finds that the heaviest days of rain and snowfall across much of North America will likely release 20 to 30 percent more moisture than they do now. Winter will see the majority of the extra precipitation, which could make flooding worse in places like the upper Midwest and the west coast.
“The big picture is clear: it’s getting warmer and wetter,” Feldman said. “This research translates that bigger picture into more practical data for infrastructure and operations planning. With this more detailed look at local impacts, we can help local officials make better-informed decisions, such as how long to make an airport runway, how much resilience to include for constructing buildings or bridges, or where to put crops or culverts.”
By more properly detecting and conserving historical extreme weather occurrences, the upgraded set of LOCA2 data has been used to train models that will more accurately represent extremes in future simulations.
“We undertook a Herculean effort of personnel and computer time not just to produce a bunch of numbers, but to produce local projections that are relevant and useful,” Feldman said. “We do so by recognizing how heat waves and storms have occurred and will occur at the local level, and projecting those forward.”
Seasonal and regional predictions
Despite local variations in the data, towards the turn of the century, researchers discovered significant trends in the LOCA2 area.
A significant portion of North America will experience roughly the same number of days with precipitation across most seasons, as well as fewer days with light and moderate amounts of precipitation. However, the number of days with the most extreme precipitation (the top 1% and 0.1 %) will increase significantly.
“People will be more affected by the really rare and most extreme events, because those are showing the biggest increase,” said Pierce, who is the lead author of the paper on extreme precipitation published in the Journal of Hydrometeorology. “The wettest day you would expect to see in five years, or 50 years, or 500 years those extreme events are going to be substantially wetter, and that’s a really big issue, because it has implications for flooding and run-off.”
Southern Canada and most of the United States will see increases in extreme precipitation days that occur primarily in winter. Depending on the emissions scenario and how severe the storm is, the number of wettest days will rise by 20–30%.
Extreme precipitation days are likely to increase across Arizona, New Mexico, and northern Mexico, mostly in the autumn. Depending on the emissions scenarios that materialize and how severe the storms are, the number of wettest precipitation days rises by 10–30%. The region is getting drier overall, but the frequency of days with extreme precipitation events is increasing, so when it does rain, it usually occurs in bigger storms.
“It’s quite interesting that you see the same kind of pattern of fewer low and medium precipitation days and more extreme precipitation days across pretty much the entire country,” Pierce said. Knowing the changing character of precipitation and the frequency of extreme events is useful in two ways, Pierce added. “One is for building new infrastructure in the future, and one is for understanding impacts upon existing facilities already there.”