A new approach can remotely map crop kinds in low- and middle-income countries with little agricultural data. The maps will assist scientists and policymakers in tracking global food supplies and estimating how they may vary in response to climate change and population growth.
Crop maps assist scientists and policymakers in tracking global food supplies and estimating how they may fluctuate in response to climate change and population growth. However, obtaining reliable maps of crop kinds cultivated from farm to farm frequently necessitates on-the-ground surveys, which only a few countries can conduct.
Now, MIT engineers have developed a method to quickly and accurately label and map crop types without requiring in-person assessments of every single farm. The team’s method uses a combination of Google Street View images, machine learning, and satellite data to automatically determine the crops grown throughout a region, from one fraction of an acre to the next.
The researchers utilized the technique to create the first statewide crop map of Thailand, a smallholder country where tiny, independent farms are the most common type of agriculture. The researchers built a border-to-border map of Thailand’s four key crops — rice, cassava, sugarcane, and maize — and identified which of the four was planted every 10 meters, without gaps, across the country. The final map attained 93% accuracy, which the researchers claim is equivalent to on-the-ground mapping efforts in high-income, large-farm countries.
The final goal is to understand agricultural outcomes like yield, and how to farm more sustainably. One of the key preliminary steps is to map what is even being grown – the more granularly you can map, the more questions you can answer.
Sherrie Wang
The team is applying their mapping technique to other countries such as India, where small farms sustain most of the population but the type of crops grown from farm to farm has historically been poorly recorded.
“It’s a longstanding gap in knowledge about what is grown around the world,” says Sherrie Wang, the d’Arbeloff Career Development Assistant Professor in MIT’s Department of Mechanical Engineering, and the Institute for Data, Systems, and Society (IDSS). “The final goal is to understand agricultural outcomes like yield, and how to farm more sustainably. One of the key preliminary steps is to map what is even being grown — the more granularly you can map, the more questions you can answer.”
Wang, along with MIT graduate student Jordi Laguarta Soler and Thomas Friedel of the agtech company PEAT GmbH, will present a paper detailing their mapping method later this month at the AAAI Conference on Artificial Intelligence.
Ground truth
Smallholder farms are frequently run by a single family or farmer who lives off the crops and cattle that they grow. Smallholder farms are estimated to support two-thirds of the global rural population and provide 80% of the world’s food. Keeping track of what is grown and where is critical for monitoring and forecasting global food supplies. However, the bulk of these small farms are in low- to middle-income nations, where minimal resources are allocated to tracking individual farms’ crop varieties and yields.
Crop mapping activities are primarily carried out in high-income nations such as the United States and Europe, where government agricultural organizations supervise crop surveys and dispatch assessors to farms to mark crops from field to field. These “ground truth” labels are subsequently incorporated into machine-learning models, which match actual crop ground labels with satellite data from the same fields. They then classify and map larger areas of farmland that assessors do not cover but that satellites automatically do.
“What’s lacking in low- and middle-income countries is this ground label that we can associate with satellite signals,” Laguarta Soler says. “Getting these ground truths to train a model in the first place has been limited in most of the world.”
The team realized that, while many developing countries do not have the resources to maintain crop surveys, they could potentially use another source of ground data: roadside imagery, captured by services such as Google Street View and Mapillary, which send cars throughout a region to take continuous 360-degree images with dashcams and rooftop cameras.
In recent years, such services have been able to access low- and middle-income countries. While the goal of these services is not specifically to capture images of crops, the MIT team saw that they could search the roadside images to identify crops.
Cropped image
In their new study, the researchers worked with Google Street View (GSV) images taken throughout Thailand — a country that the service has recently imaged fairly thoroughly, and which consists predominantly of smallholder farms.
Starting with over 200,000 GSV photos randomly collected across Thailand, the team removed images of buildings, trees, and general vegetation. Crop-related photos totaled approximately 81,000. They set aside 2,000 of these and sent them to an agronomic, who identified and labeled each crop kind by eye. They then trained a convolutional neural network to automatically generate crop labels for the remaining 79,000 images using a variety of training methods, including iNaturalist, a web-based crowdsourced biodiversity database, and GPT-4V, a “multimodal large language model” that allows a user to input an image and ask the model to identify what it depicts. For each of the 81,000 images, the model generated a label of one of four crops that the image was likely depicting — rice, maize, sugarcane, or cassava.
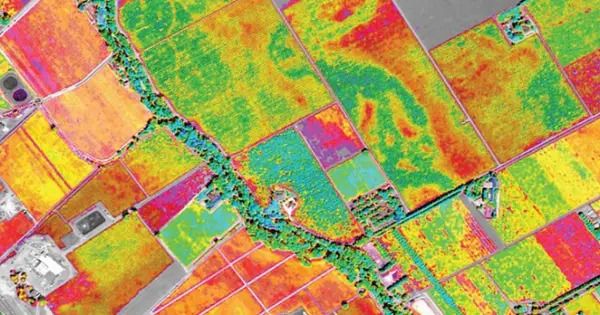
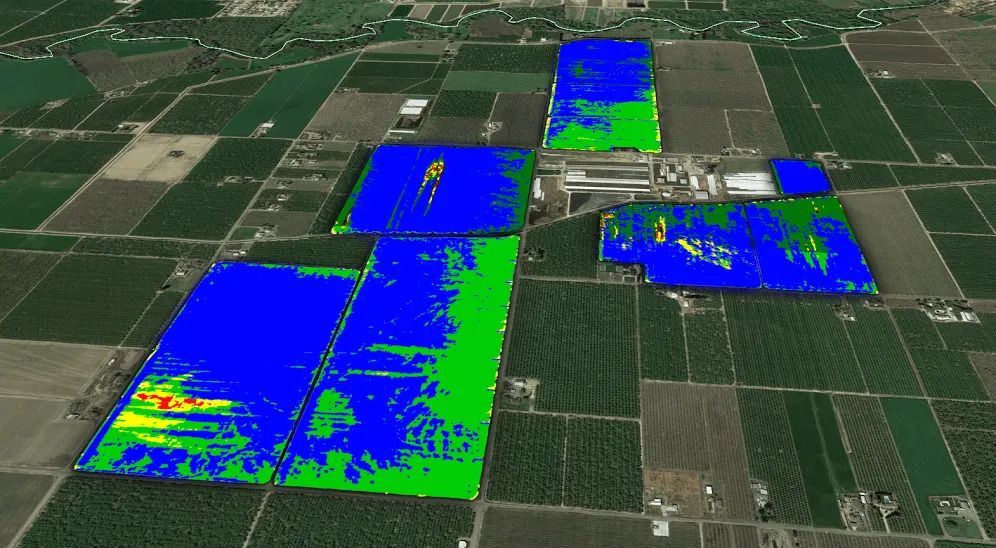
The researchers then paired each labeled image with the corresponding satellite data taken of the same location throughout a single growing season. These satellite data include measurements across multiple wavelengths, such as a location’s greenness and its reflectivity (which can be a sign of water).
“Each type of crop has a certain signature across these different bands, which changes throughout a growing season,” Laguarta Soler notes.
The team trained a second model to make associations between a location’s satellite data and its corresponding crop label. They then used this model to process satellite data taken of the rest of the country, where crop labels were not generated or available. From the associations that the model learned, it then assigned crop labels across Thailand, generating a country-wide map of crop types, at a resolution of 10 square meters.
This first-of-its-kind crop map included locations corresponding to the 2,000 GSV images that the researchers originally set aside, that were labeled by arborists. These human-labeled images were used to validate the map’s labels, and when the team looked to see whether the map’s labels matched the expert, “gold standard” labels, it did so 93 percent of the time.
“In the U.S., we’re also looking at over 90 percent accuracy, whereas with previous work in India, we’ve only seen 75 percent because ground labels are limited,” Wang says. “Now we can create these labels in a cheap and automated way.”
The researchers are planning to map crops throughout India, where roadside photos from Google Street View and other services have lately become available.
“There are over 150 million smallholder farmers in India,” Wang said. “India is covered in agriculture, almost wall-to-wall farms, but very small farms, and historically it’s been very difficult to create maps of India because there are very sparse ground labels.”
The team is working in India to create crop maps that will be used to drive policies aimed at analyzing and improving yields as global temperatures and populations rise.