The cereal grains are seeds of the grass family that are valuable food for us and domestic animals. The word cereal is derived from Ceres, the Roman Goddess of Grain. The principal cereal crops are rice, wheat, maize or corn, oats, barley, rye and sorghum. The term cereal is not limited to these but also flours, breads, biscuits, and the food products made from cereal grains. These are the staple foods in diets for most population groups, and a source of essential nutrients, antioxidants and metabolites for human beings. 80% of dry matter of cereals is carbohydrate, and these are the main sources of energy, contributing 70-80% of the requirement. A hundred gram of cereals gives more than 340 kcal of energy into the body. Protein content of different cereals varies. Rice contains less amount of protein compared to other cereals [1, 2]. But rice protein is of better quality than the others. Cereals, when consumed with pulses, the protein quality improves due to mutual supplementation. Cereals are deficient in lysine and rich in methionine. Pulses are deficient in methionine and rich in lysine. Hence, there is improvement in protein quality during mutual supplementation. Not only that, rice cereals together with pulses can nearly meet the essential fatty acid requirement for an adult. Cereals contain some mineral elements like potassium, magnesium, calcium, copper, zinc, iron, and manganese in small quantities. About 95% of minerals are the phosphates and sulphates of potassium, magnesium and calcium. Whole grain cereals are important sources of B vitamins. Cereals do not contain either vitamin A or C except maize which contain small amount of carotenes. Certain cereals contain many enzymes such as amylase, protease, lipase and oxido-reductase etc. Some popular cereals of Bangladesh, collected from Chittagong city area (Table 6.1), have been selected for analysis.
Potato chips are prepared directly from potato. Potatoes contain approximately 80% water. The dry matter content of potato tubers tends to increase from 16% at the time of flowering to 20% when the leaves begin to die. The dry matter is mainly starch and comprises two-thirds of the total solid or dry matter. In potato, the sugar content (sucrose, glucose and fructose) is normally low, but varies greatly during storage under various temperatures. Protein exists in potato tubers in both soluble and insoluble forms. The soluble protein constitutes over 50% and insoluble protein about 10% of the total nitrogen content. Potato protein has high nutritional value. Enzymes present in potato include hydrolase, lyase, transferase, isomerase, synthetase, and polyphenoloxidase. The functions of polyphenoloxidase are very important in potato. The fat content in potato tubers is low. The minerals present in potato are potassium, phosphorus, magnesium, sulphur, chlorine, calcium, iron, silicon, zinc, boron, bromine, aluminium, sodium, manganese, iodine, fluorine, copper, cobalt, arsenic, lithium, molybdenum, and nickel. Calcium, phosphorus and iron are considered as the most important to the nutritional value of potato tubers. It has been reported that soil type and fertilizer content of soil can cause variations in the mineral content of potato tuber. Generally 100 g of potato contain 40 to 215 mg of Mg, 2 to 70 mg of Fe, 1 to 3 mg of Zn, 1200 to 2800 mg of K, 10 to 130 mg of Ca, 100 to 600 mg P etc. Potato tubers also contain the vitamin A, B and C [7, 8]. Therefore, potatoes are considered to be good sources of vitamins. Vitamin C is an important constituent of potato tubers and is present in large quantities. In some areas of Bangladesh, particularly when the price of rice or wheat is high, potatoes are used as staple food. The wealthy and urban residents consume potatoes as potato chips. Now it is common in our daily diet. Mainly children and adolescents are the main consumers of potato chips. The potatoes are cut into very thin slices and deep fried (and recently, baked) until crisp and then cooled and packaged for sale. The simplest chips are just fried and salted, but a wide variety of seasonings (mostly made using monosodium glutamate, HOOC-CH(NH2)-(CH2)2-COONa) and a few herbs or spices are used to produce various ‘seasoned’ chips. A number of popular brands of chips available in Chittagong city area, as shown in Table 6.1, have been taken for analysis.
Hot drinks are a malted milk. In the initial stage of manufacturing milled malted barley and wheat flour are mashed together in hot water where the starch is converted into sugars. To this sugar solution dairy powders are added. The water content is then evaporated off to form syrup which is dried in vacuum band driers to form a cake. This cake is milled into the finished powder. This is then fortified with vitamins and minerals as required [10]. These are known as nutritionally rich drinks and suitable for every one. This food item is getting more popularity among the urban population as sources of energy, minerals and vitamins. Nescafe is a brand of instant coffee made by nestle. Most instant coffees are actually freeze dried crystals of brewed coffee. The coffee is brewed in an industrial plant. It is not widely consumed in Bangladesh. Some popular hot drinks of Bangladesh, as shown in Table 6.1, were collected for analysis purpose.
The concentrations of minerals in foods vary depending on inherent (varieties, maturity, genetics, and age) and environmental conditions (soil, geographic location, season, water source, use of fertilizers etc.) of plants and animals and on methods of handling, processing and cooking. Some toxic metals such as Pb, Cd, Cr, Ni, and As in the crops are studied because most of them are related to environmental problems and have also accumulative properties. Traces of these metals can be found naturally in the environment but industrial and anthropogenic activities increase their level, which lead to pollution. As a result, the levels of the metals in foodstuffs have been studied and reported around the world, especially in developed countries.
Table 6.1: Cereals, chips and hot drinks description
| Food types | Brand name /Local name | Country of production |
|
Cereals
| Noodles (Cocolaa) Instant Noodles (Maggia) Pop corn Coiled vermicelli (Banafula) Versatile vermicelli Sujib Barley Sago Flattened rice Parched rice Cornflakes |
Bangladesh
Philippines |
|
Chips | Meridian chickena Mr. Twista Pran potatoa Bombay potatoa Bombay ringa Ispahani potatoa Bombay potato sticksa Real mastia Al-amin pickkya Lay’sa |
Bangladesh
India |
|
Hot drinks | Complana Boosta Maltovaa Horlicksa Bourn vitaa Vivaa Nescafea Milo nestlea |
India
Malaysia |
a = brand name; b = local name
In many developing countries such data are not readily available. Like other developing countries, the contents of essential metals and toxic metals in cereals, chips, and hot drinks are not elaborately studied, so far, in Bangladesh. In addition, there is scarcity of information on the metals intake in our population. So, the main purpose of the present study was to assess the essential metals (Fe, Cu, Mg, Co and Zn), and toxic metals (Pb, Cd, Cr, Ni and As) in these foods (cereals, chips and hot drinks).
Experimental
Sampling
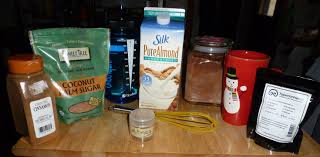
The sampling procedure was done according to the guideline of the International Network of Food Data Systems (INFOODS) [24, 25]. Cereal, chip and hot drink samples were chosen for analysis depending on their consumption frequency by the people of Chittagong city area. These food items, as shown in Table 6.1, were purchased from supermarkets and grocery stores in the Chittagong metropolitan region of Bangladesh. Cereal samples were collected from six different markets of city area of Chittagong. Each cereal was the composite of six same individual samples but hot drink and chips samples were not composite samples. The purchased food items were immediately taken to the laboratory. Food items such as cereals that were not prepackaged when purchased were packed in double polyethylene bags before being transported. The remaining food items e.g. hot drinks and chips were kept in their original packages. All food items, fresh and processed, was analyzed without further preparation. A total of twenty eight samples were analyzed for Fe, Cu, Mg, Co, Zn, Pb, Cd, Cr, Ni and As concentrations.
Sample digestion
Each food sample was weighed 1 to 3.5 grams for analysis. Wet digestion of the sample was performed with nitric acid and perchloric acid mixture. Each selected food sample was considered as one batch. For each batch 60 mL of HNO3 and HClO4 (5:1) was added with weighed sample. The resulting mixture was refluxed at 120 – 125 0C for 10 – 15 hours until a clear solution appeared. The volume of the digested solution was reduced to 20 – 30 mL by condensation. This condensed solution was cooled to room temperature which was diluted with RD H2O and filtered through Whatman-40 filter paper into a 50 mL volumetric flask and made up to the mark with RD H2O. This digested sample solution was used as stock solution. Similarly, all other sample solutions under the present investigation were prepared and transferred the stock solution into a pre cleaned plastic bottle. These were stored at refrigerator for spectroscopic measurement.
For each batch, the following control samples were simultaneously analyzed: (a) analytical blanks (b) enriched samples (spiked) and (c) certified reference metal solutions. Control samples were measured on daily basis. All control analyses and one sample per batch was done in triplicate. Control charts were used to minimize the analytical error.
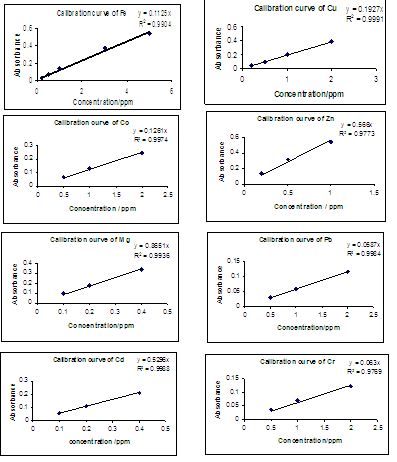
Calibration curves
The following calibration curves were used for the determination of concentration of metals from the sample’s stock solutions.
Results and Discussion
The concentration of essential metals such as Fe, Cu, Mg, Co and Zn, and toxic metals such as Pb, Cd, Cr, Ni and As in the selected popular cereal, chip and hot drink samples were determined by using AAS method. The determined amount of the essential metals in the studied cereals, chips and hot drinks are presented in Table 6.2, Table 6.3 and Table 6.4, respectively. The concentrations of toxic metals in the same samples are shown in Table 6.7, Table 6.8 and Table 6.9. Each metal in each digested sample solution was measured in triplicate. Their mean value and standard deviation (SD) are shown in the Tables. The measured values of the metals were compared with the literature value of the same foods of different parts of the world. The average concentrations of the metals were calculated in the studied cereals, chips and hot drinks samples. The comparative level of the toxic metals in cereals, chips and hot drinks was compared with the maximum permissible limit of the respective metal of the foodstuffs;
Essential metals
The concentration of five essential metals such as Fe, Cu, Mg, Co and Zn in cereal, chip, and hot drink samples were determined. The concentration of Fe, Cu, Mg, Co and Zn in cereals were 101-475, 5.29-18.26, 46-999, 0.05-0.44 and 27.6–69.3 mg kg–1, respectively, whereas mean content of these metals in cereals were 282.55, 9.21, 345.84, 0.27 and 59.8 mg kg-1, respectively (Table 6.2). The mean concentrations of Fe, Cu, Mg, Co and Zn in chips were found 157.29, 0.37, 207.2, 0.12 and 17.87 mg kg-1, respectively (Table 6.3). Hot drinks showed the ranges of 102- 216, 0.17-2.77, 52.82–155.8, 0.04–0.39 and 2.96-456 mg kg-1 for Fe, Cu, Mg, Co and Zn, respectively. Mean concentration of these metals in hot drink samples were found 187.8, 1.57, 100.2, 0.22 and 228.2 mg kg-1, respectively (Table 6.4).
Table 6.2: Amounts (mg kg-1) of essential metals in cereals
| Cereals | Fe | Cu | Mg | Co | Zn |
| Flattened rice | 256±0.04 | 8.34±0.004 | 936±0.04 | 0.44±0.01 | 60.6±0.04 |
| Suji | 271±0.01 | 5.29±0.003 | 190±0.03 | 0.29±0.01 | 50.3±0.1 |
| Cornflakes | 241±0.02 | 6.89±0.01 | 253±0.02 | 0.3±0.02 | 39.3±0.04 |
| Parched rice | 229±0.03 | 6.13±0.01 | 324±0.01 | 0.27±0.08 | 47.7±0.1 |
| Sago | 101±0.04 | 7.67±0.01 | 47.69±0.04 | 0.05±0.013 | 27.6±0.03 |
| Cocola egg noodles | 313±0.02 | 18.26±0.01 | 272±0.03 | 0.29±0.05 | 47.6±0.02 |
| Pop corn | 168±0.04 | ND | 999±0.04 | 0.38±0.01 | 68.3±0.04 |
| Coiled vermicelli | 475±0.02 | 15.25±0.03 | 228±0.1 | 0.18±0.08 | 67.3±0.1 |
| Versatile vermicelli | 345±0.02 | 10.06±0.003 | 241±0.04 | 0.17±0.02 | 69.3±0.1 |
| Instant noodles | 416±0.02 | 8.88±0.01 | 267±0.03 | 0.3±0.02 | 67.3±0.1 |
| Barley | 293±0.02 | 5.34±0.01 | 46.54±0.03 | ND | 52.7±0.03 |
Table 6.3: Amounts (mg kg-1) of essential metals in chips
| Chips | Fe | Cu | Mg | Co | Zn |
| Meridian chicken | ND | BDL | 118±0.04 | 0.11±0.02 | 15.86±0.01 |
| Mr. Twist | ND | BDL | 131±0.03 | 0.14±0.01 | 5.05± 0.04 |
| Bombay potato | 187±0.02 | 1.76±0.01 | 168±0.02 | 0.11±0.003 | 12.68±0.04 |
| Bombay ring | 127±0.04 | 0.96±0.001 | 106±0.02 | 0.18±0.014 | 55.6±0.01 |
| Ispahani potato | 159±0.02 | BDL | 203±0.03 | 0.11±0.012 | 3.29±0.1 |
| Bombay potato sticks | 79±0.04 | BDL | 163±0.04 | 0.11±0.011 | 4.67±0.01 |
| Realmasti | ND | BDL | 200±0.01 | 0.16±0.01 | 25.8±0.04 |
| Pran potato | 180±0.03 | BDL | 203±0.01 | 0.1±0.004 | 27.7± 0.06 |
| Al-amin pickky | 201±0.03 | BDL | 178±0.04 | 0.1±0.015 | 6.75±0.1 |
| Lay’s | 168±0.03 | 0.98±0.001 | 602±0.02 | 0.11±0.023 | 21.29±0.1 |
ND: Not Determined; BDL: Below detection limit; ± = Standard deviation
Table 6.4: Amounts (mg kg-1) of essential metals in hot drinks
| Hot drinks | Fe | Cu | Mg | Co | Zn |
| Complan | ND | ND | ND | 0.21±0.04 | 198±0.02 |
| Boost | ND | ND | ND | 0.2±0.06 | 347±0.01 |
| Maltova | ND | ND | ND | 0.23±0.07 | 259±0.03 |
| Horlicks | 215±0.04 | 2.77±0.03 | 67.92±0.04 | 0.24±0.02 | 277±0.01 |
| Bourn vita | 216±0.33 | 1.35±0.001 | 88.13±0.04 | 0.39±0.02 | ND |
| Milo nestle | 198±0.24 | 1.97±0.1 | 155.8±0.03 | 0.33±0.01 | 456±0.04 |
| Viva | 208±0.13 | ND | 52.82±0.01 | 0.14±0.04 | 57.6±0.02 |
| Nescafe | 102±0.12 | 0.17±0.02 | 136.23±0.03 | 0.04±0.06 | 2.96±0.02 |
Iron
Among the samples, these cereals contain the highest mean concentration of Fe (282.55 mg kg-1) whereas Fe content in chips and hot drinks were found lower than that of cereals. Olivares et al. reported that cereals of Chile contain 30 to 70 mg kg-1 of Fe. They also reported that cereals and legumes are the main food groups for Fe and Cu. Our results showed that the concentration of Fe in cereals was 5 to 7 times higher than their reported value. Gopalani and co-workers reported that potato chips of Nagpur, India contain 0.7 to 23.5 mg kg-1 of Fe [9]. Hence, our chips samples contain 5 to 10 times higher amount of Fe than the chips of India. As our cereals and chips contained plentiful Fe, the additional requirement of Fe can be fulfilled by taking these foods.
Copper
Copper contents (5.29-18.26 mg kg-1) in our studied cereals are higher than chips (0.96-1.76 mg kg-1) and hot drinks (0.17-2.77 mg kg-1). The concentration of Cu in the studied chips and hot drinks samples was within the recommended permissible limit (10 mg kg-1). Most of the cereal samples contain Cu closer to the maximum permissible limit (MPL) except two samples (Cocola egg noodles and coiled vermicelli). Bhutto et al. found 1.64 to 4.32 mg kg-1 of Cu in different types of wheat samples (cereals) of Sindh, Mirpurkhas, Nawabshah and Khairpur, Pakistan. Salama and Radwan found 2.83 to 8.01 mg kg-1 of Cu in cereals, cereal products and fried potatoes of Egypt. They reported potato chips of Egypt contain 1.626 to 1.992 mg kg-1 of Cu. Narin et al. found 0.28-1.26 mg kg-1 of Cu in chips of Turkey. Thus, Cu levels in the present investigated samples were comparable with those reported for similar foodstuffs.
Zinc
Hot drink samples contain higher concentration of Zn (3.29-456 mg kg-1) than that of cereals (39–69 mg kg-1) and chips (3.29-55 mg kg-1). The maximum allowable limit of Zn for grains and beans is 50 to 100 mg kg-1. Hence, cereal and chips contain permissible amount of Zn. Most of the studied hot drinks samples are enriched with Zn and contain higher level than the permissible limit except Viva (57.6 mg kg-1) and Nescafe (2.96 mg kg-1). It is reported that dairy products, meat, liver, eggs, beans and lentils, yeast, nuts, seeds and wholegrain cereals are good sources of dietary Zn. Our study showed that the hot drink samples were enriched with Zn, which can fulfill the Zn deficiency of the consumer of this area. For comparison, concentration of Zn in cereals, chips and hot drinks of different parts of the world as well as the concentration of the same metal in the studied samples is depicted in Table 6.5. This Table clearly indicated that zinc level in our studied chips and cereals is higher than other countries.
Table 6.5: Comparison of Zn levels (mg kg-1) of the studied cereals and chips with overseas cereals and chips
| Food types | Country | Zn (mg kg-1) | Reference |
|
Cereal | Pakistan Korea Egypt Iran Bangladesh | 17.3-37.5 1.35-24.15 2.35-14.45 7.32-12.17 39.3-69.3 | [29] [34] [19, 30] [35] Present work |
| Chips | India Korea Egypt Bangladesh | 0.8-15.5 0.35-6.11 3.84-6.84 3.29-55.6 | [8] [34] [30] Present work |
Cobalt
The cobalt content was found little (0.04-0.44 mg kg-1) in tested cereals, chips and hot drinks. Among the samples Nescafe hot drinks (0.04 mg kg-1) and Sago cereal (0.05 mg kg-1) had negligible cobalt content. The average cobalt content in cereals was higher than hot drinks and chips (Table 6.2, Table 6.3 and Table 6.4). The cobalt level of cereals and chips was compared with other countries as shown in Table 6.6. Table 6.6 showed higher cobalt level in our samples than that of other countries except India. FAO/WHO set up the maximum permissible limit of Co in foods is 3.5 mg kg-1 [36]. Hence, the concentration of cobalt in the studied samples was within the recommended permissible limit. Normal daily intake of cobalt is reported to be in the range 2.5 to 3.0 mg day-1. In this context, our investigated samples contain very safe range of cobalt concentration.
Table 6.6: Comparison of Co levels (mg kg-1) in cereals, chips and hot drinks with overseas cereals, chips and milks
Food type | Country | Co (mg kg-1) | Reference |
Cereal | India Spain Yemen Bangladesh | 0.85-1.85 0.026 0.05-0.18 0.17-0.44 | [8] [37] [38] Present work |
Chips | India Spain Canada Bangladesh | 0.45-1.05 0.02 0.08 0.1-0.16 | [8] [37] [39] Present work |
Milk Hot drink | Spain USA Bangladesh | 0.004 0.003 0.04-0.39 | [37] [40] Present work |
Magnesium
The minimum Mg content was found in Viva (52.86 mg kg-1) hot drinks, in barley (46.54 mg kg-1) cereal and in Bombay ring (106 mg kg-1) chips. The maximum Mg content was found in Milo (155.8 mg kg-1) hot drinks, in popcorn (999 mg kg-1) cereals and in Lay’s (602 mg kg-1) chips (Table 6.2, Table 6.3 and Table 6.4). This study showed that the magnesium content in cereal was significantly higher than that of chips and hot drinks. This study showed also that the hot drink samples were not good sources of Mg. Hence, the hot drinks manufacturer can increase Mg content in their products. Orzaez et al. showed that cereals of Spain contain the Mg ranging between 70 to 670 mg kg-1. It is generally assumed that most diets contain adequate quantity of magnesium (Mg). Dietary surveys also showed that self-selected diets normally contain 200-250 mg of Mg per day, which is below the Recommended Dietary Allowances (RDA) of 300-400 mg per day for adults. This study showed that cereals and chips having plenty of magnesium content might fulfill the shortage of the magnesium.
Toxic metals
Lead
The concentration of Pb in eleven varieties of cereals was evaluated and found between 0.08 – 8.73 mg kg-1. The mean concentration of Pb in cereals was 1.88 mg kg-1. Minimum content of Pb was found in coiled vermicelli (0.08 mg kg-1) and the maximum in pop corn (8.73 mg kg-1) (Table 6.7). Lead content in chips was found between 0.27-12.9 mg kg-1. The mean concentration of Pb in chips was 2.63 mg kg-1. Isphahani potato chips contain the minimum content of lead (0.27mg kg-1) whereas maximum content of Pb was found in Realmasti chips (12.9 mg kg-1, Table 6.8). The mean concentration of Pb in hot drinks was found 0.45 mg kg-1 with a range of 0.03-1.1 mg kg-1. Nescafe contained the minimum amount of Pb (0.03 mg kg-1) and Horlicks contained the maximum amount of Pb (1.1 mg kg-1, Table 6.9).
The concentration of Pb in cereal (rice, wheat, popcorn, barely, maize) of China, India, Italy, Malaysia, Taiwan, Thailand, Egypt and Bangladesh was reported as: 0.04–0.10, 0.027–0.218, 0.003–0.088, 0.004–0.27, 0.005–0.031, 0.013–0.215, 0.065-0.393 and 0.3-1.1 mg kg-1, respectively [30, 45-47]. Salama and Radwan reported that the concentration of Pb in fried potatoes of chip and lay’s chip of Egypt was 0.065 and 0.159 mg kg-1, respectively. Onyedika and Nwosu reported the potato of Nigeria contain 0.02 to 0.14 mg kg-1 of Pb. From these reported data and our results, we observed that some of our cereal samples had elevated Pb concentrations while a few samples contain similar amount of this metal. The study also revealed that some of the cereals and chips contain higher amount of Pb as compared to the maximum permissible limit (2.5 mg kg-1). These cereals were parched rice (5.32 mg kg-1) and pop corn (8.73 mg kg-1) and chips were Realmasti (12.9 mg kg-1) and Alamin pickky (5.4 mg kg-1). The concentration of Pb in the locally prepared chip (Realmasti) was alarming level than the other brands of chips. It was reported that an adult body can tolerate maximum 0.5 mg of Pb per day. Therefore, peoples should be very cautious to take such type of non branded chips.
Cadmium
Cadmium concentration in cereals was 0.01-0.7 mg kg-1. The maximum concentration of cadmium was found in parched rice (0.7 mg kg-1). The minimum concentration of cadmium was found in instant noodle (0.01 mg kg-1). About 50% of cereal samples contained lead below the detection limit. But some cereal e.g. flattened rice, Cocola egg noodles and popcorn contained noticeable amount of cadmium i.e. 0.6, 0.12 and 0.13 mg kg-1, respectively (Table 6.7). The mean concentration of cadmium in chips was found 0.03 mg kg-1. Five chip samples out of ten contained very negligible amount of lead. It is reported that rice, barely, wheat and popcorn of Egypt contain 0.091, 0.136, 0.131 and 0.194 mg kg-1 of cadmium, respectively. The same authors reported that chips of Egypt contain 0.1-0.54 mg kg-1 of cadmium. The cadmium content in rice of Nigeria, Japan, Italy and Bangladesh were 0.029-0.49, 0.043-0.9, 0.016-0.67 and 0.016-0.77 mg kg-1, respectively. Most of the reported value of Cd for cereals and chips were resembled to our results.
Cadmium concentration in the studied hot drinks was found 0.03-0.46 mg kg-1 (Table 6.8). The mean concentration of cadmium in hot drinks was 0.07 mg kg-1. The maximum concentration of cadmium was in Horlicks (0.46 mg kg-1) and minimum in Bourn vita i.e. 0.03 mg kg-1 (Table 6.9). The content of cadmium in five hot drinks out of eight was below the detection limit. This indicated that many of hot drinks were almost free from cadmium contamination. These foods were not harmful for human body in terms of cadmium toxicity.
It is reported that rice is an important source of Cd intake as it has been the main source of energy for the daily life of people in many areas of Asia including Bangladesh [52, 53]. In the present studies, the cadmium content in both cereals and chips was significantly lower than the tolerance limit of Cd for human (0.2 mg day-1).
Table 6.7: Amounts (mg kg-1) of toxic metals in cereals
| Cereals | Pb | Cd | Cr | Ni | As |
| Flattened rice | 1.0±0.002 | 0.6±0.002 | 0.79±0.003 | BDL | 1.16 |
| Barley | 0.41±0.001 | BDL | BDL | BDL | 0.67 |
| Suji | BDL | 0.08±0.001 | BDL | BDL | 0.91 |
| Cornflakes | 0.6±0.002 | BDL | 0.34±0.01 | 0.37±0.001 | 1.98 |
| Parched rice | 5.32±0.008 | 0.7±0.002 | 1.11±0.01 | 10.6±0.001 | 2.99 |
| Sago | 0.41±0.001 | BDL | 0.97±0.01 | BDL | 0.1 |
| Cocola egg noodles | 2.47±0.001 | 0.12±0.002 | 0.41±0.001 | BDL | 0.04 |
| Pop corn | 8.73±0.002 | 0.13±0.01 | 1.96±0.003 | 1.35±0.01 | 0.63 |
| Coiled vermicelli | 0.08±0.001
| BDL | 2.78±0.005 | BDL | BDL
|
| Versatile vermicelli | 0.85±0.001 | BDL | 1.2±0.01 | 1.13±0.02 | 1.14 |
| Instant noodles | 0.83±0.001 | 0.01±0.002 | 1.16±0.002 | 0.73±0.001 | 1.39 |
Table 6.8: Amounts (mg kg-1) of toxic metals in chips
Chips | Pb | Cd | Cr | Ni | As |
| Meridian chicken | 2.43±0.07 | BDL | 1.97±0.07 | 1.75±0.02 | 5.06 |
| Mr. Twist | BDL | 0.02±0.002 | 1.57±0.06 | 0.18 | BDL |
| Pran potato | 2.13±.03 | BDL | 1.82±0.04 | 0.12 | 2.63 |
| Bombay potato | 0.28±0.01 | BDL | 1.74±0.03 | 0.25 | 0.23 |
| Bombay ring | 1.28±0.03 | 0.05±0.001 | 1.33±0.01 | 0.5±0.04 | 2.25 |
| Isphaani potato | 0.27±0.03 | BDL | 1.26±0.04 | 0.31 | BDL |
| Bombay potato sticks | 0.94±0.03 | 0.03±0.001 | 1.36±0.01 | BDL | 1.87 |
| Realmasti | 12.9±0.05 | 0.02±0.002 | 1.38±0.06 | 16.04±0.28 | BDL |
| Lay’s | 0.67±0.03 | BDL | 1.09±0.05 | BDL | 1.48 |
| Al-amin pickky | 5.4±0.03 | 0.13±0.02 | 1.99±0.06 | 1.21 | 6.29 |
Table 6.9: Amounts (mg kg-1) of toxic metals in hot drinks
Hot drinks | Pb | Cd | Cr | Ni | As |
| Complan | 0.23±0.02 | BDL | 0.09±0.01 | 0.38±0.02 | 0.97 |
| Boost | 0.71±0.04 | BDL | 0.16±0.003 | BDL | 0.56 |
| Maltova | 0.4±0.03 | BDL | 0.15±0.02 | 0.22±0.02 | BDL |
| Horlicks | 1.1±0.03 | 0.46±0.02 | 0.12±0.02 | 0.32±0.04 | BDL |
| Bourn Vita | 0.48±0.05 | 0.03±0.004 | 0.08±0.03 | BDL | 0.41 |
| Milo Nestle | 0.7±0.06 | 0.1±0.01 | 0.09±0.03 | 0.34±0.02 | 0.05 |
| Viva | BDL | BDL | 0.12±0.02 | BDL | 0.58 |
| Nescafe | 0.03±0.002 | BDL | 0.02±0.001 | BDL | 0.16 |
Chromium
The concentration range of Cr in the studied cereals was 0.34-2.78 mg kg-1 and the average concentration of the metal for these samples was found 0.97 mg kg-1. The maximum concentration of Cr was found in coiled vermicelli (2.78 mg kg-1). Cornflakes contained the minimum concentration of Cr (0.34 mg kg-1) (Table 6.7). The concentration of Cr in barley and Suji was below the detection limit.
The mean concentration of Cr for the studied chips was 1.55 mg kg-1. The Cr content in these chips was ranged 1.09-1.99 mg kg-1(Table 6.8). Maximum Cr content in chips was found in Al-amin chip (1.99 mg kg-1) and minimum in lay’s (1.09 mg kg-1). The results of cereals and chips showed that the mean concentration of Cr of chips was 30% higher than the mean concentration of cereals.
The chromium concentration in hot drinks was 0.02 to 0.16 mg kg-1. Maximum Cr content was found in Boost (0.16 mg kg-1). The concentration of Cr in hot drinks such as Nescafe, Milo Nestle, Bourn vita, Complan were in the lower range i.e. 0.02 to 0.09 mg kg-1 (Table 6.9).
Nigerian wheat flours contain the chromium concentration in the range of 0.005 to 0.012 mg kg-1. Potato chips and biscuits of Nagpur City of India contain very negligible amount of Cr as compared to the maximum permissible limit (20 mg kg-1) [8]. This reported data of Cr for cereals and chips was similar to our results.
Therefore, these studied samples are free from Cr contamination and these were not harmful for human as died. Moreover, little amount of Cr (0.06 mg day-1) [54] is required for maintaining some of the body’s metabolic functions that naturally obtain from foodstuffs. The studied samples are safe sources of Cr for human body.
Nickel
The concentration of Ni in six cereal samples out of eleven was below the detection limit. These samples are flattened rice, barley, suji, sago, cocola egg noodles and coiled vermicelli. The nickel concentration in other cereal was 0.37 to 10.6 mg kg-1. The mean concentration of nickel was 1.29 mg kg-1. Maximum nickel was found in parched rice (10.6 mg kg-1) and minimum was found in cornflakes i.e. 0.37 mg kg-1 (Table 6.7).
The nickel content in chips was 0.12 to 16.04 mg kg-1. Only Lay’s and Bombay potato chips had below the detection limit of nickel. The mean content of nickel was found to be 2.04 mg kg-1. Maximum nickel concentration was in Real Masti chip (locally produced, 16.04 mg kg-1) and minimum concentration of Ni was in Pran potato chip (0.12 mg kg-1, Table 6.8).
The maximum concentration of Ni was in Complan hot drink (0.38 mg kg-1) and minimum concentration of Ni was found in Maltova drink (0.22 mg kg-1, Table 6.9). Fifty percent of the studied hot drinks were free from nickel contamination i.e. the concentration of nickel in these samples was below the detection limit. The average value of nickel was 0.16 mg kg-1 for hot drinks.
Cereal of Nigeria (wheat flours) contained 0.006 to 0.06 mg kg-1 of nickel. Bhutto et al. reported that cereals of Sindh, Pakistan were free from Ni contamination. Wang et al. reported that rice of China contain 0.027 to 0.078 mg kg-1 of Ni.
Potato chips of Nagpur of India contain 3.05 to 10.5 mg kg-1 of nickel. The reported value of Ni for cereals was far lower than our results of cereals but the Ni concentration of the studied chips was more close to the result of chips of India. The recommended maximum level of nickel in foods is 1.0 mg kg-1.
The concentration of nickel in cereal samples was also slightly higher than the recommended value of Ni for foods. So, the consumers should take caution about these food items during consumption. Nickel content in hot drinks was in safe limit as compared to MPL value. As the hot drink samples contain permissible amount of Ni, these foods could not pose any health risk of Ni toxicity in human body.
Arsenic
Arsenic concentration in cereals was found to be 0.04 to 2.99 mg kg-1. The minimum concentration of arsenic was in cocola egg noodles (0.04 mg kg-1) and the maximum concentration of arsenic was in parched rice (2.99 mg kg-1, Table 6.7). The average concentration of arsenic of chip samples was 1.98 mg kg-1. The maximum concentration of arsenic was in Al-amin picky chips (6.29 mg kg-1) and minimum in Bombay potato chips (0.23 mg kg-1, Table 6.8). Arsenic content in hot drinks was between the ranges of 0.16 to 0.97 mg kg-1. Maximum concentration of As was in Complan (0.97 mg kg-1) and minimum was found in Nescafe (0.16 mg kg-1, Table 6.9).
Cheng et al. reported that cereal of China (rice grain) contain 0.034 to 0.090 mg kg-1 of arsenic [56]. Serbian cereals (wheat grains) contained 0.02 to 0.162 mg kg-1 of arsenic [58]. It has been reported that fish, shell fish, sea weed, meat and grain products contain the highest levels of arsenic than other foods. However most of the arsenic is in a nontoxic organic form [59]. The studied cereal and chip samples contain higher amount of arsenic than the reported value. The maximum permissible limit of arsenic (inorganic) in foods is 1.5 mg kg-1. JECFA has established PTWI for As (inorganic) of 0.015 mg kg-1 of body weight.
In the present study, approximately 9% of cereals and 50% of chips had the As concentration beyond the MPL value while the concentration of arsenic in hot drink samples was significantly below the maximum permissible limit. This indicated that arsenic can enter into the chips during manufacturing. Therefore, excess intake of chips might have chance to expose of arsenic to human.
Conclusion
The results of this study indicated that most of the cereals, chips and hot drinks samples are rich sources of essential nutrients (metals) such as Fe, Cu, Mg, Co and Zn. The study will help to asses the nutrition status of these foodstuffs. On the other hand, some of the foodstuffs contain higher level of the toxic metals. Therefore, dietary habits influence the risk of the toxic metal exposure especially to infants. Because it is common for infants to consume a lot of hot drinks and chips in Bangladesh. Poor hygiene and storage facilities may be the causes of metal contamination of cereals and chips. Nevertheless, more attention should be paid through in-depth investigation with regular intervals. However, the present study provides additional information on metal pollution in these foods which may create potential threat to the health, security and safety of these foods to the consumer, especially for the infants.