Introduction of the Study:
This report is being assigned as a part of the Degree MBA, (Dissertation). To prepare this report under the state of University’s requirement, I accommodate my dissertation program in Tamanna Limited. For the completion of the course, as an essential part I had prepared report. This report is being formed on the “An Analysis of Financial Statement of Tamanna Ceramics Limited”. From the very beginning of my dissertation I have worked on Financial Analysis. After few weeks later I was shift on financial department. And I worked on Financial Analysis and Valuation. For that reason I made my Report on An Analysis of Financial Statement of Tamanna Ceramics Limited, Head office.
Objective of the Study:
Before any work, setting up of objectives is half of completing the job. The reason behind this study is clear; I am motivated enough towards achieving my goal. My objective is to give special emphasis on achieving and gathering knowledge about An Analysis of Financial Statement of Tamanna Ceramics Ltd. in detail. The objective of my study can be divided into two segments. These are given below:
Primary Objective:
The primary objective of this report is to meet the requirements of the course, MBA Dissertation.
Secondary Objective:
The secondary objectives are:
To know the concept of An Analysis of Financial Statement of Tamanna limited.
Importance of An Analysis of Financial Statement in context of Bangladesh .
To have an exposure on the Ceramics Industries environment of Bangladesh.
To present an overview of Tamanna Ceramics Ltd.
To identify the problem & suggest remedial measure for the development of Tamanna Ceramics Ltd.
To relate the theories of financial analysis with the practical activities.
Scope of the study:
This report titled “An analysis of financial statement of Tamanna Ceramic Ltd.” is outcomes of MBA course of semester-5 named “Dissertation Program”, MBA department of Bangladesh Islami University assigns me at Tamanna Ceramics Ltd to introduce me so that I might get overall concept practical activities of ceramics sector. I have calculated and discussed of different ceramics sectors, such as ratio analysis, trend analysis, industry analysis, cross section analysis, risk analysis , common size analysis, statement analysis, sensitivity analysis etc. as it has been directed to present the report in a way of reflecting the understanding of the sectors which are present in our country. Qualitative methods are used to describe all the functions and mechanisms used to perform trade functions by using different information from their annual reports & others sources.
Methodology of the Study:
Different data and information are required to meet the goal of this report. Those data and information were collected from various sources, such as, primary and secondary, which is showed below:
Primary data were collected from:
- Personal interviewing and interacting customers at Tamanna Ceramics limited.
- Face to face conversations with the employees at various fields.
- Observing various organizational procedures.
Secondary data were collected from:-
1. Internet and Home page in the Tamanna limited.
2. Annual report of Tamanna Ceramics Ltd.
3. Progress report/ Statement affairs of the company.
4. Several kinds of training sheet of the organization.
To prepare this report, standard method of report writing has been used for writing this report different types of data were needed to complete and analyze. The required data were collected by suing both primary and secondary source for collecting data from secondary source; company annual report articles, newspapers and other materials were used. After completion of the data these were sorted into different categories. Through the report these data were analyzed by using standard statistical methods. And on the basis of this analysis the findings of the report were made.
Limitation of the Study:
To make a report various aspects and experience are needed. But I have faced some barriers for making a complete and perfect report. These barrier, s or limitations, which hinder my word, are as follows:
Difficulty in accessing data of its internal operations.
Non -availability of some preceding and latest data.
So, my information was withheld to retain the confidentiality of the organization.
I was placed to this organization for only 1 2 weeks o f time & working like a regular employee hindered the opportunity to put the effort for the study.
To prepare a report on the achieved practical experiences in a short duration like ours (only three months) is not an easy task. Non-availability of more recent data as well as information of different activities of TCL was a great problem for me to depict the actual.
Time Schedule of the Study:
Time schedule for dissertation work has been set up by supervisor form December 27, 2012 to January 27, 2013.
For Data collection : 20 days
Data Analysis : 25 days
Visiting at the Organization : 15 days
Clarification : 05 days
Report preparing : 10 days
Printing & binding : 15 days
Total : 90 days
Profile of Tamanna Ceramics Ltd:
Name of the Co. : Tamanna Ceramics Ltd.
Main Address : Head office: 60/E, Purana Paltan, Dhaka-1000.
Contact Details : Tamanna Limited
Telephone: 9565393, 7162241, 9570953, 9566860
Fax: +88-02-9570953
E-mail:tamanna@tamannaltd.com,
Website: www.tamannaceramic.com
History of the Organization:
Tamanna Group of Company has started its primary Function with the social activities. To elevate the poverty from the society the Managing Director of Tamanna Limited Company has come forward and established in 2000.
Advice the interests and well being of the mass people of the society irrespective of race, Gender, culture and religion. To provide program supports to people in needs in more subtle approach and mobilize community towards mainstream of Development.
Tamanna Limited Company, which is incorporated with the Registrar of the join stock Companies, Govt. of the Peoples Republic of Bangladesh during the fag end of the Nineteen century in accordance with the company act in 1994.
We have been engaged in Electrical and electronics business in the name of Tamanna Limited since 2000 as a dealer of other electronics company. Across the domestic Perimeter we had been started our imported Business with the Peoples Republic of China since 2004.
Very soon, probably begging of the 2010 January the 2nd and 3rd unit of Tamanna Ceramics Limited Company is going to set up with an auto bricks plants and machinery shall be procured from China Company.
Main objects of the Company:
a) To earn Profit and Increase Job opportunity in Bangladesh and Change Socio and economic by Islamic base in shariah.
b) Islamization in Private business section.
Project Details (At a Glance)
- Tamanna Limited co.
- Tamanna Electronics Ltd.
- Tamanna Tiles & Sanitary
- Tamanna Housing
- Tamanna Interiors Ltd.
- Tamanna Handicrafts
- Tamanna Transport
- Tamanna Tours & Travels
- Tamanna Machinery (On going)
- Tamanna SME Technology Support
Function of Organization:
Entrepreneur development Training,
To set up small and Medium Industry and to give all assistance,
To set up small and Medium Industry and to give all assistance,
To give Technical support to set up socio-agro small Industry,
To assist marketing on entrepreneur products and processing the raw products and inter co-operation among the entrepreneur on account of disputed or unsettled cases.
Staffing Information:
Tamanna has a group (more than 320 employees) of highly educated, skilled, Semi-skilled, Honest, sincere and dedicated workers. All those workers showed their experience in various field for a long period. We have got modern Training, Communication instruments, useful information and network which may support to do the feasibility study & different analysis for need, demand, market, raw materials, technology, skill manpower & management of respective project.
Departmental Information:
There are 12 Departments of Tamanna such as
i) Accounts Section
ii) Human Resource Section
iii) Admin Section
iv) Commercial Section
v) IT Section
vi) Marketing Section (Electronics Goods)
vii) Marketing Section (Tiles & Ceramics)
viii) Central Store Section (Electronics Goods)
ix) Central Store Section (Tiles & Ceramics)
x) Interiors & Exteriors Design Section
xi) Service Providing Section
xii) Maintenance Section
Tamanna Research & Development (R&D) unit is composed of highly and sophisticated Eggers group. Our R&D is more efficient to provide project profile from initial set-up to production label works and maintenance support of the project.
Project & Branch Location:
We have no. of Electronics and Tiles Show rooms in various districts/cites and town all over the Bangladesh as an Indenter we are approaching to the Bangladeshi Business Promoters to set up small scale middle scale and bigger scale Industry and giving assurance from Begging to production labels. Here it is very notable that all those machinery are Indenting/ importing from China.
Industrial Ceramics:
Ceramics are widely used in industries for a range of purposes. Due to their high heat resistant properties and extreme durability, they can be used successfully in refractory, metallurgical, glassware, oil refinery and such other processes. Today industrial ceramic manufacture is a huge industry in itself and there are several multimillion-dollar companies in the field, researching and producing industrial ceramics.
Industrial Ceramic Materials:
The materials used in the production of industrial ceramics are different from those used in ceramic art forms. These materials need to be strong and durable and be able to withstand very high temperatures. The common materials used are oxides, carbides and nitrides of nonmetallic inorganic minerals.
Industrial ceramic materials have the following properties:
- They should have a very low coefficient of thermal expansion so that they can withstand a high temperature. This low expansion also helps the ceramics to be manufactured without much error, or else there could be a dimension difference when the ceramic is cooling down after firing.
- They should have high melting points so that they can sustain the high temperatures used in most industrial processes.
- They should be insulating to electricity.
- They should be insulating to heat.
- They should have a high wear resistance
Preparation of Industrial Ceramics:
Industrial ceramics are made from nonmetallic mineral clays. The minerals are first taken in the right proportion to obtain all the required properties, and then they are crushed and ground into a very fine consistency. In order to remove impurities, purifying chemical solutions are added to the mixture. Any impurity is removed in the form of a precipitate. Then wax is added to minerals. Wax acts as a binder and it holds the clay together. Plastics could also be added in case the ceramic requires to be more tenacious and durable. Plastic also improves the pliability of the ceramic.
Different processes are used to manufacture industrial ceramics. Some include:
I. Slip casting
II. Pressure casting.
III. Injection Molding.
IV. Extrusion
When all the processes are accomplished, and the ceramic has got its shape, the materials are molded and heated for a second and final step. This final stage in the preparation of industrial ceramics is called ‘densification’. In general the manufacture of industrial ceramics is complicated and involves numerous processes using very specific and expensive production equipment.
Industrial Ceramic Products:
Ceramics are used in the industry for a wide variety of purposes that mostly involve insulation. The following are some areas where industrial ceramics are used:
a) In fuel industry, industrial ceramics are used to manufacture prop pants that are required for hydraulic fracturing process of oil wells and natural gas reserves.
b) In electric appliances, industrial ceramics are used for glazing and insulation. Zirconium oxide is commonly used in manufacturing such industrial ceramics.
c) In refractory, industrial ceramics are used to manufacture crucibles and various other objects that require a high heat resistance. For the same purpose, ceramics are also used in kilns, furnaces, glass manufacture and metallurgical operations.
d) Various electric fittings are made from aluminum oxide ceramics. Castings for fuse wires, holders of light bulbs, etc. are some of the areas where industrial ceramics are used.
e) Industrial ceramics are used to manufacture filter slices which are used to filter out waste gases in industrial operations.
f) Zirconium ceramics are used to manufacture tips for circular knitting machines.
g) Industrial ceramics are used in manufacture of ovens and thermal storages in industry.
Industrial ceramics are an important part of the day-to-day operations in any manufacturing process that involves heat and electricity. Though these may not be beautiful to look at, they are indispensable and highly useful to the industrial world.
Industry Life Cycle:
Life cycle models are not just a phenomenon of the life sciences. Industries experience a similar cycle of life. Just as a person is born, grows, matures, and eventually experiences decline and ultimately death, so too do industries. The stages are the same for all industries, yet industries cycle through the stages in various Lengths of time. Even within the same industry, various firms may be at different life different life cycle stages.
Strategies of a firm as well as of competitors vary depending on the stage of the life cycle. Some industries even find new uses for declining products, thus extending the life cycle. Others send products abroad in hopes of extending their life.
The growth of an industry’s sales over time is used to chart the life cycle. The distinct stages of an industry life cycle are: introduction, maturity, and decline. Sales typically begin slowly at the introduction phase, and then take off rapidly during the growth phase. After leveling out at maturity, Sales then begin a gradual decline, In contrast, profits generally continue to increase throughout the life cycle, as companies in an industry take advantage of expertise and economies of scale and scope to reduce unit costs over time. Industry life cycle has five stages:
- Pioneering development
- Rapidly accelerating industry growth
- Mature industry growth
- Stabilization and market maturity
- Deceleration of growth and decline
Our Ceramics industry in Bangladesh is in Rapidly Accelerating Industry Growth Stage in industry life cycle.
Rapidly accelerating industry growth
This stage starts when the product of the industry is accepted by the market. Further demand increases rapidly. The number of firms in the in the industry is limited at this stage and hence the firms can experience substantial backlogs of orders. Hence prices can be increased or discounts can be decreased and therefore profit margins are high. The capacity utilization goes up and even though productive capacity is increased, sales increase more rapidly. Hence high profit margins occur simultaneously with high sales growth, Profits explode. Sales growth can be high up to even 50 percent year and profits can grow over 100 percent a year as a result of the low earnings base and high profit margins and increasing efficiency of the firms.
Analysis of Industry Competition:
Competition and Expected Industry Returns, Porter’s concept of competitive strategy is described as the search by a firm for a favorable competitive position in an industry
- To create a profitable competitive strategy, a firm most first examine the basic competitive structure of its industry
- The potential profitability of a firm is heavily in flounced by the profitability of its industry
Porter’s Five Forces:
Porter’s five forces is a framework for the industry analysis and business strategy development developed by Michael E. Porter of Harvard Business School in 1979. It uses concepts developing, Industrial Organization (IO) economics to derive five forces that determine the competitive intensity and therefore attractiveness of a market. Attractiveness in this context refers to the overall industry profitability. An “unattractive” industry is one where the combination of forces acts to drive down overall profitability. Avery unattractive industry would be one approaching “pure competition”.
For our ceramics Industry Competition, we use porters five forces model in the below:
a) Threats of new entrants is low because-
Threats of new entrants: In this sector, govt. gives different types of subsidies and relaxing laws and regulations, which attract new firms to entire new firms to enter in this industry.
Capital requirement is high.
Hard have access to the distribution channels of excising companies.
b) Bargaining power of buyer is low because-
Bargaining power of buyer: As there are different substitute products, the buyers can exercise their bargaining power which may effects in case of setting price.
- Undifferentiated or standard product offering competitive price
- No potential threats of backward integration by buyer
- Customers are fewer prices sensitive.
c) Bargaining power of supplier is high because-
Bargaining power of supplier: As our raw materials are supplied by different suppliers and we are highly depended on them, so, suppliers also have the bargaining power option which may effect on our sufficient amount of production level.
There is little number of suppliers who regulate the market according to their own association.
- Lack of substitute product (raw materials)
- Credible threats of forward integration by suppliers
d) Threats of substitute are low because-
Threats of substitute Products: As our products depends on customer sentiment and willingness to buy those and the existence of different substitute products, involves competition among the funds.
There is minimum substitute product.
e) Industry rivalry is high because-
Rivalry among the existing competitors: As under this industry there are many firms operating their business in the economy. So, there exists strong rivalry among the competitors.
The market is large.
Industry is growing at a slow rate and yet to attain its best so supply gap is evident.
Fixed costs are high which make it hard for exiting from the market.
Strong capital based and technologically company is in operation and grabbing major market shares.
Growth and Trends:
Ceramics are widely used in industries for a range of purposes. Due to their high heat resistant properties and extreme durability, they can be used successfully in refractory, metallurgical, glassware, oil refinery and such other processes. Today industrial ceramic manufacture is a huge industry in itself and there are several multimillion dollar companies in the field, researching and producing industrial ceramics.
Business Cycle and Industry Sector:
Economic trends can and do affect industry performance. By identifying and monitoring key assumptions and variables, we can monitor the economy and gauge the implications of mew information on our economy, outlook & industry analysis. Most observers believe that-Industry Performance is related to the stage of the business cycle is different and those who look only at history miss the evolving trends that will determine future market performance.
During a recession some industries do better than others. Consumers are staples, such as-Pharmaceuticals, foods and beverages. Outperform other sectors during a recession because, although overall spending may decline, people still spend money on necessity So, these “defensive” industries generally maintain their values. Similarly, if a weak domestic economy causes a weak currency, industries with large export components to growing economics may benefit because, their goods become more cost competitive in overseas markets.
As Tamanna ceramics Ltd. is considered as it is able to hold the position of peak in economic cycle.
Macro Economic Variables:
Generally, investors should not invest based upon the current economic environment because the efficient market has already incorporated current economic news into security prices. Rather, it is necessary to forecast important economic variables at least 3 to 6 months is the economics, consumer sentiment etc. which may affect different industry.
a) Inflation:
Higher Inflation is generally negative for the stock market, because, it causes higher market interest rate, it increase uncertainty about future prices & cost, and it harms firms that can not pass their cost increases on to consumers. Although these adverse effects are true for most industries, some industries benefit from inflation.
Tamanna ceramics Ltd. that has high operating leverage may benefit because, many of their costs are fixed in National terms where as, revenues increase with inflation.
b) Interest rate:
As Tamanna ceramics Ltd is an existing company in our economy, there has a negative impact of interest rate if it rises. Higher interest causes higher operating expenses which may reduce our profit margin.
c) International Economy:
As we are producing export quality finished products, if we can create free trade zones in different countries it will broaden the market internationally and overall economic conditions will be developed.
Structural Economic Changes and Alternatives Industries:
There are three Structural Economic Changes and Alternatives Industries .These are given below:
a) Demographics:
The study of demography includes much more than population growth and age distributions. Demographics also include the geographical distribution of people, the changing ethnics mix in a society and changes in a society and changes in income distribution.
b) Technology:
Trends in technology can affect numerous industry factors including the product or service and how it is produced and delivers. As new technologies are innovated, we are able to increase our productivity and reduce our delivery time and increase our profit margin.
Literature Review:
Jannat Ara Parvveen (2007) says, The main focus of this research is to critically evaluate the sustainability issues of Interest-free Micro –Finance Institutions (MFIs ) in general and a recently developed micro finance model – Rural Development Scheme RDS of Islamic Bank Bangladesh Limited (IBBL) in particular. Recently, in micro finance literature the term , sustainability or self-sustainability” has been discussed and discussed and analyzed widely among the practitioners, researchers and policy makers as an important development indicator of both MFIs and its clients. It is well known that only efficient sustainable basis.
Salma Sairally (2009) says, In order to fulfill the shariah objective of promotion the welfare of society, financial institution are expected to consciously align their decisions and actions so that these are socially responsible. An integral policy approach toward corporate social responsibility would constitution assigning explicit social objectives to financial institution over and above their economics , legal , shariah , and ethical responsibility. Alternatively, the task of undertaking socially oriented projects could be argued as being a discretionary responsibility of OFLs ,with the objective of CSR being sough merely a peripheral practice. Recent debates on the evaluation of the practices of financial highlighted the profits economic efficiency. A divergence between the economic literature on finance and the cource taken by the practice field of finance. A assessment of this contention motives this study.
Hassan Rashid (2007) says, In the wake of meteoric growth of industry in Pakistan. Financing company has capture two percent market share in only three years period. To evaluate this progress attempt has been made to measure and analysis the performance of finance in Pakistan. To actualize this objective analysis has been made in four areas of financial ratios i.e. profitability, liquidity, risk and solvency and community development. Means , standard deviation, t-test and f-test has been used to test the significant of the results of the analysis. The basic source of data for this paper is annual reports of industries. This study finds out that nor only finance in industry are less profitability than the conventional industry in Pakistan. But the basic modes of industry are do better in Pakistan.
Mr. Imtiaz Masud (2009) Quality Assurance Manager of NZDPBL 2009: He always says “Safety and Hygiene is first”. So he decided that written (making) an article on health and safety, later management thought that it’s a good guide line for this organization as health, safety and hygiene and it’s learned in many ways such as: i) Employees medical check up ensuring with diagnosis test before joined his work place. ii) Ensuring periodically medical check up iii) Wearing the safety tools e.g. safety shoes, safety goggles, safety musk etc is must. iv) Providing first aid and fire fighting training of the employees to making them self confident to facing any emergency period. v) Employees awareness training program provided about health, hygiene, HACCP and GMP etc. The management of NZDPBL has identified that the requirement of General Principals of Hygiene and Good Manufacturing Practices (GMP’s) are considered to be a solid foundation for the development of the HACCP system to ensure the food safety. The application of General Principals of Food hygiene and GMP’s provide the basic environment and operating condition that are necessary for the production of safe food. Therefore prior to HACCP system implementation, NZDPBL has defined and implemented the new prerequisite program and reviewed the existing programs for compliance with the General Principals of Hygiene and GMP’s and to verify whether all the necessary controls and documentation are in place. Inadequate program/actions may lead to additional Critical Control Points that would have to be identified, monitored and maintained the HACCP Planning activities.
ISO 22000:2005: Milk and milk products in very essential food item to getting much more nutrition from it and built our body by absolving proper nutrition. Bangladesh is 3rd world country member of south Asia, most of the people of lives under poverty line, they are not highly educated and inadequate knowledge about and also lack of health and safety knowledge. The people Bangladesh always suffered from mal nutrition. Producing milk and milk products not fulfilled from agricultural sector of Bangladesh, so for this gap fulfilment of nutrition to many organization imported milk and milk products. To provide about it the management and staff of the NZDPL with a clear understanding of HACCP procedures, so that all employees are aware of their role in the attainment and maintenance of safety within the scope of their duties in order to company will continue to be successful in the health safety and hygiene.
To satisfy the requirements of ISO 22000:2005 Safety Management System Standards (CAC/RCP 1-1969, Rev.3 (1997), Hazards Analysis Critical Control Points (HACCP) System and Guidance for its application annex to the Recommended International Code of Practise – General Principles of Hygiene,), which has been accepted by the Company as a cornerstone of its Safety System.The main objective of health, safety and hygienic prevent hazards, which are significant for safety according to the likelihood occurrence of hazards and severity of their adverse health effects; by applying controls at points in a milk packaging process where safety hazards could be controlled, reduced or at least eliminated to an acceptable level to comply with ISO 22000:2005 requirements, local regulatory requirements as well as customer requirements and prevent adulteration of product.
With the aim of ensuring the safety and quality of products, this guide line will help to:
- Enhances products safety and reduces risk
- Provide greater confidence of consumer / customer
- Reduce production cost through reducing wastage
- Facilitate compliance with local regulatory requirements
- Reduce current and potential hazards which have an adverse health effects
- Identify the outcomes for the use of HACCP principles for the NZDPBL production process,
- Develop and implement the HACCP plans that ensure product safety throughout the milk powder packing and distribution accordance with the HACCP requirements.
Mr. Abdus Selim (2010): In next finally previous method are implemented by the Quality Assurance Manager of NZDPBL. He has also some added and deleted of these topics and revised to up dated. The safety management system of New Zealand Dairy Products Bangladesh Limited meets the requirements of the Codex general principles of hygiene (CAC/RCP-1969 Rev. 4, 2003), Hazard analysis and critical control points (HACCP) and endorses the local safety legislations. He has been produced a guide line of Safety Management System to provide the management and staff with a clear understanding of NZDPBL safety policies, procedures, authorities and responsibilities for implementing the food safety program so that all employees are aware of their role in the attainment and maintenance of safety within the scope of their duties.
The main purpose and objectives of this guide line is to prevent – or at least, minimize the likelihood of – safety hazards being introduced through the work environment; to control biological, chemical, and physical contamination of the product(s), including cross-contamination between products; and to control safety hazard levels in the product and product processing environment. This manual applies to all service operations within the organization that may have an impact – directly or indirectly – on safety in order to conduct our core business of packing of milk powder and selling under specific Brand Names in sachets of different sizes. The safety manual makes reference to the documented procedures and other manuals. It is a controlled document, which is approved by the Managing Director. This manual will be revised as required to reflect the food safety system currently in use.
Mr. Tareq Chowdury (2010): Ensuring security for all is one the major challenges that Bangladesh faces today specially in dairy sector. Despite significant achievement in production and availability, food security at national, household and individual levels remains a matter of major concern for the Government mainly due to natural calamities. Bangladesh since independence has made significant achievements in improving the health of the people, and services to its ever-growing population. Inspite of these achievements, malnutrition is still an important public health problem in the country. Though malnutrition can not be fully eliminated, however, by increasing safe and quality supply the complex problem of malnutrition could be reduced to some extent. But safety issues receive less attention and, not infrequently, it has been mostly overlooked except some recent development in the country. The International Conference on Nutrition, 1992, in its Plan of Action mentioned that, achieving food security has three dimensions. First and important one is to ensure a safe and nutritionally adequate food supply both at the national and household level. The Plan of Action of the World Food Summit, 1996 also echoes with this aspect. So, it is well documented that has been a clear and important dimension of security and without ensuring safety and quality the objective of the security is not achievable.
Safety is defined as the all conditions and measures that are necessary during the production, processing storage, distribution, and preparation of milk to ensure that it is safe. Milk and milk products may be contaminated with microorganisms, chemical substances or physical substances, which may cause acute to chronic illness, from diarrhoea to cancers, as well as it may cause poor physical and mental growth of children Food-borne illnesses may have serious social and economic consequences, including losses in productivity, income and income-generating capacity. People who consume unsafe food and/or suffer from diseases are less productive. This means lower incomes, less access to increased food insecurity. The application of good agricultural and hygienic practices (GMP and GHP) in food or milk production, processing and distribution improves safety and at the same time reduces losses, thereby increasing food availability and security at the national and international level. Countries that are able to ensure safe can take advantage not only in reducing the incidence of diseases also promote international trade opportunities in and agricultural products and promote tourism and thereby increase income levels and household security.
Ratio Analysis:
The information contained in the four basic financial statements is of major significance to various interested parties who regularly need to have relative measures of the company’s operating efficiency. Relative is the key word here, because the analysis of financial statements is based on the use of ratios or relative values. Ratio analysis involves methods of calculating and interpreting financial ratios to analyze and monitor the firm’s performance. The basic inputs to ratio analysis are the firm’s income statement and balance sheet.
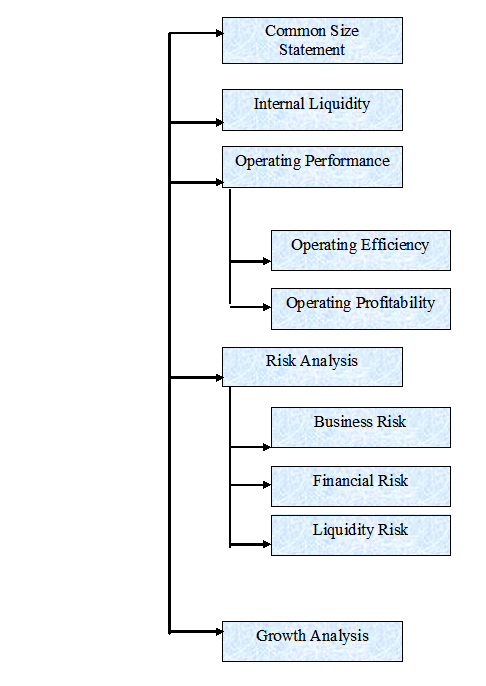
Categories of Financial ratios:
Financial ratios can be divided for covariance into five basic categories, such as:-
- Common Size Statement
- Internal Liquidity (solvency)
- Operating Performance
- Operating Efficiency
- Operating Profitability
- Risk Analysis
- Growth Analys
There are five categories of financial ratios .These are given as details as follows.
Common Size Statement:
“Normalize” balance sheet and income statement items to allow easier comparison of different-size firms. A common-size balance sheet expresses all balance sheet accounts as a percentage of total assets. A common-size income statement expresses all income statement items as a percentage of sales.
Tamanna Ceramics Ltd Common Size Analysis (Balance Sheet) & (Income Statement) As at 31, December 2011 | |||
Particulars | 2011 | 2010 | 2009 |
| Net Assets: |
|
|
|
| Property plant and equipment | 91.97 | 96.29 | 93.53 |
| Investment in shares | 8.35 | 8.04 | 1.30 |
| Capital work in Progress | 5.50 | 0 | 0 |
| Long term loan | 6.25 | 8.36 | 7.45 |
| Current Assets: | |||
| Inventories | 5.50 | 27.51 | 44.14 |
| Trade Debtor | 11.50 | 7.97 | 15.35 |
| Advances & Deposits | 2.62 | 2.67 | 6.10 |
| Cash & Cash equivalents | 0.59 | 0.22 | 0.32 |
| Current Liabilities & Provisions | |||
| Short term loan from Banks | 29.21 | 27.86 | 36.25 |
| Long term loan current maturing | 12.32 | 10.14 | 10.80 |
| Creditors, Accruals & other payables | 3.24 | 3.14 | 4.02 |
| Income tax payable | 3.09 | 1.963 | 3.33 |
| Net current assets | (5.82 | (4.74) | 6.33 |
Total | 100 | 100 | 100 |
Table no: 4.1 | 2011 | 2010 | 2009 |
% | % | % | |
| Financed By: |
|
|
|
| Shareholder’s equity | 78.91 | 76.44 | 53.98 |
| Share capital | 26.75 | 22.52 | 34.46 |
| Fixed asset revaluation surplus | 43.11 | 43.56 | 10.04 |
| Retained earnings as per statement of changes is equity | 9.05 | 10.35 | 9.47 |
| Non current liabilities: | |||
| Long term loan secured | 15.19 | 23.21 | 45.75 |
| Long term loan | 5.50 | 0 | 0 |
| Differed tax liability | 0.40 | 0.35 | 0.26 |
Total | 100 | 100 | 100 |
Table no: 4.2
Common Size Analysis of profit loss account For the year ended 31, December 2011 | |||
Particulars | 2011 | 2010 | 2009 |
% | % | % | |
| Revenue (turnover) from net sales | 100 | 100 | 100 |
| Cost of Good sold | 67.00 | 67.30 | 67.12 |
| Gross profit | 32.98 | 32.64 | 32.87 |
| Operating Expenses | 5.19 | 5.92 | 5.77 |
| Administrative Expense | 2.26 | 2.58 | 2.07 |
| Selling & Distribution Expense | 2.92 | 3.34 | 3.70 |
| Operating profit | 5.18 | 3.34 | 2.70 |
| Financial Expenses | 12.36 | 12.30 | 14.66 |
| Other Income | 0.0052 | 0.0308 | 0.0301 |
| Net profit before cont. to WPWF | 15.43 | 14.44 | 12.47 |
| Contribution to worker’s participation | 0.73 | 0.68 | – |
| Net profit before tax | 14.59 | 13.75 | 12.47 |
| Income tax expenses | 4.53 | 1.99 | 3.08 |
| Net profit after tax | 10.16 | 11.76 | 9.39 |
Table no: 4.3
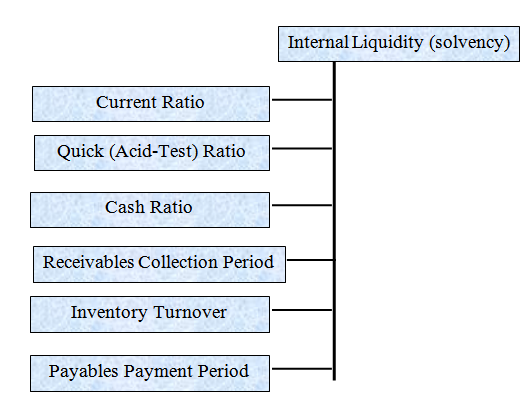
Internal Liquidity (solvency):
Liquidity refers to the ability of a firm to meet its short-term financial obligations when and as they fall due. The main concern of the internal liquidity (solvency) ratios indicates the ability of the firm to meet future short-term financial obligations.
Liquidity ratios are divided into following types, such as:-
- Current Ratios
- Quick (Acid-Test) ratio
- Cash Ratio
- Receivables Collection Ratio
- Inventory Turnover
- Payables Payment Period
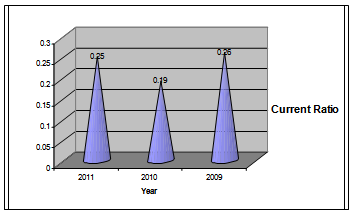
Current Ratio:
A measure of liquidity is calculated by dividing the firm’s current assets by its current assents by its current liabilities. Current assets normally include cash, marketable securities, accounts receivable and inventories. Current liabilities consist of account payable, short term notes payable short-term loans, current maturities of long term debt, accrued income taxes and other accrued expenses (wages).
Formula:
Current Ratio:
Interpretation:
The standard value for current ratios is 2.1 i.e. for paying tk. 1 current liabilities we have tk. 2 current assets. In case of Tamanna Ceramic Ltd. We have current ratio for 2008, 2009, 2010 are respectively 0.87, 0.89, 1.11 over the year, it is noticed that the current ratio is decreasing, but still we are in a position of paying our current liabilities by using our current assets i.e. it is acceptable.
Quick (Acid-Test) Ratio:
A measure of liquidity is calculated by dividing the firm’s current assets minus inventory by its current liabilities. This ratio realizes that some of current assets are not easily convertible to cash e.g. inventories.
The quick ratio, also referred to as acid test ratio, examines the ability of the business to cover its short-term obligations from its “quick” assets only (i.e. it ignores stock).
Formula:
Quick (Acid-Test) Ratio:
Particular | 2011 | 2010 | 2009 |
| Current Assets | 18411470 | 6851977 | 6204407 |
| Inventory | 361541096 | 247899640 | 294189238 |
| Current Liabilities | 1503775825 | 1340348231 | 1142008842 |
| Total | 0.2526656964 | 0.1900637544 | 0.26303968406 |
Interpretation:
The standard value for current ratios is 2.1 i.e. for paying tk. 1 current liabilities we have tk. 2 current assets. In case of the company. We have current ratio for 2008, 2009, 2010 are respectively 0.25, 0.19, 0.26 over the year, it is noticed that the quick ratios of each year are less than standard 1:1 i.e. we are unable to pay out current liabilities by using our current assets. So it is unacceptable.
Cash Ratio:
The most conservative liquidity ratio is the cash ratio, which related the firm’s cash and short-term marketable securities to its current liabilities.
Formula:
Cash Ratio:
Particular | 2011 | 2010 | 2009 |
| Cash | 18411470 | 6851977 | 6204407 |
| Current Liabilities | 1320809490 | 1193107130 | 1263361276 |
| Total | 0.013 | 0.0057 | 0.0049 |
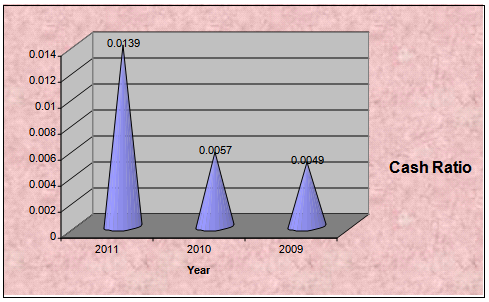
Interpretation:
For the year 2008, 2009, 2010 the cash ratio of Tamanna Ceramics Ltd. are respectively 0.014, 0.006, 0.050. So, it can be said that the company has not enough cash to meet up their current liabilities which is unsatisfactory.
Receivables Collection Period:
The average amount of time needed to collect accounts receivable.
The average receivable collection period measures the quality of debtors since it indicates the speed of their collection.
• The shorter the average collection period, the better the quality of debtors, as a short collection period implies the prompt payment by debtors.
• The average collection period should be compared against the firm’s credit terms and policy to judge its credit and collection efficiency.
• An excessively long collection period implies a very liberal and inefficient credit and collection performance.
• The delay in collection of cash impairs the firm’s liquidity. On the other hand, too low a collection period is not necessarily favorable, rather it may indicate a very restrictive credit and collection policy which may curtail sales and hence adversely affect profit.
Formula:
Average collection period:
Particular | 2011 | 2010 | 2009 |
| 360 | – | – | – |
| Account receivable turnover | 5.56 | 5.64 | 4.70 |
| Total | 64.69 | 63.77 | 76.44 |
Interpretation:
In the year 2010, 2009, 2008 the average collection period of Tamanna Ceramics Ltd. are respectively 64.69, 63.77 & 76.44 bill collecting time of them is not in time.
Inventory Turnover:
This ratio measures the stock in relation to turnover in order to determine how often the stock turns over in the business. It indicates the efficiency of the firm in selling its product. It is calculated by dividing he cost of goods sold by the average inventory.
Formula:
Inventory turnover:
Particular | 2011 | 2010 | 2009 |
| Cost of Goods Sold | 1136510173 | 1030525596 | 930468259 |
| Inventory | 856891425 | 850594114 | 840595049 |
| Total | 1.32 | 1.21 | 1.10 |
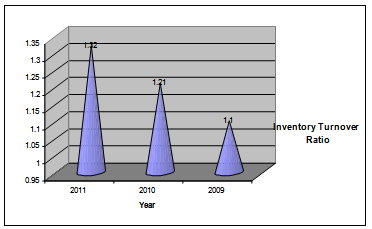
Interpretation:
In the year 2010, 2009 2008 the inventory turnover ratio are respectively 1.32, 1.21, 1.106. So the company is maintaining the liquidity of its inventory in an efficient way.
Payables Turnover:
The average amount of time needed to pay accounts payable.
Formula:
Payable Turnover:
Particular | 2011 | 2010 | 2009 |
| Cost of Good Sold | 1136510173 | 1030525596 | 1030525596 |
| Average Trade payable | 101895079 | 97671671 | 77127125 |
| Total | 32.73 | 34.59 | 27.32 |
Interpretation:
In the year 2010, 2009, 2008 the payable turnover ratio of Tamanna Ceramics Ltd. are respectively 32.73,34.59,27.32 that means we are paying our liabilities in time.
Operating Performance:
The ratios that indicate how well the management is operating the business can be divided into two subcategories:
Operating Efficiency Ratios:
Efficiency ratios examine how the management uses its assets and capital, measured in terms of the dollar of sales generated by various asset or capital categories.
This ratio can be divided into three categories. Such as:
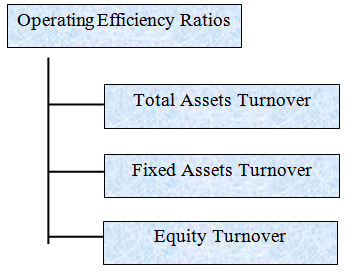
Total Assets Turnover:
Indicates the efficiency with which the firm uses its assets to generate sales. Assets turnover is the relationship between sales and assets.
- The firm should manage its assets efficiently to maximize sales.
- To total assets turnover indicates the efficiency with which the firm uses all its assets to generate sales.
- It is calculated by dividing the firm’s sales by its total assets.
- Generally, the higher the firm’s total asset turnover, the more efficiently its assets have been utilized.
Formula:
Total Assets turnover:
Particular | 2011 | 2010 | 2009 |
| Sales | 1695710571 | 1529918239 | 1386130532 |
| Total Assets | 9117221248 | 8638636962 | 4517370926 |
| Total | 18.59 | 17.71 | 30.68 |
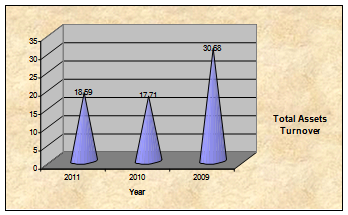
Interpretation:
In the year 2010, 2009, 2008 the total assets turnover ratio respectively 0.19, 0.18, 0.312 which are lower than the industry average i.e. 0.77. That means the company is not generating sufficient level of business.
Fixed Assets Turnover:
The net fixed assets turnover ratio reflects the firm’s utilizations of fixed assets.
Formula:
Fixed Assets turnover:
Particular | 2011 | 2010 | 2009 |
| Sales | 1695710571 | 1529918239 | 1386130532 |
| Total Assets | 2889104937 | 2993818409 | 16792824187 |
| Total | 68.03 | 51.10 | 77.31 |
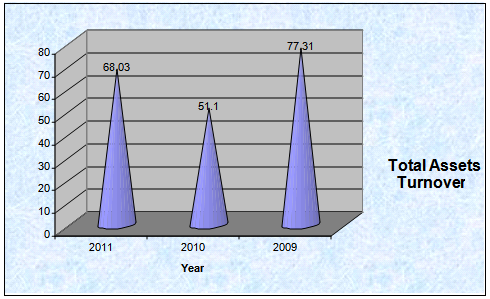
Interpretation:
In the year 2010, 2009, 2008 the fixed assets turnover ratio respectively 68.03,21.10,77.31 which are lower than the industry average i.e. 1.70. That means our company position on fixed assets is not satisfactory.
Operating Profitability Ratios:
Profitability ratios analyze the profits-
1. As a percentage of sales and
2. as a percentage of assets and capital employed.
It can be divided into eight categories. Such as:
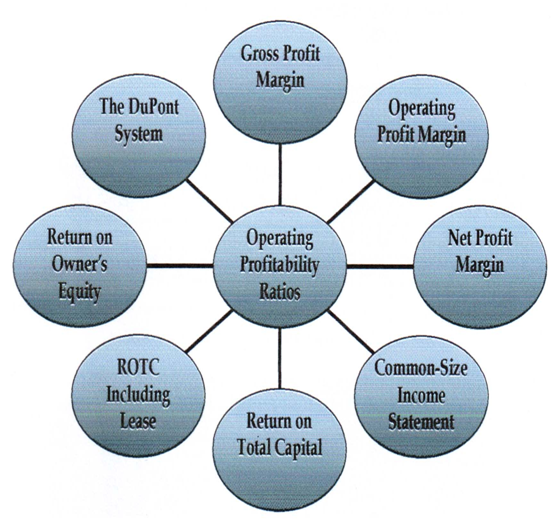
Figure: Types of operating profitability ratios
Gross profit margin:
Measures the percentage of each sales dollar remaining after the firm has paid for its goods. Normally the gross profit has to rise proportionately with sales. It can also be useful to compare the gross profit margin across similar businesses although there will often be good reasons for any disparity.
Formula:
Gross profit margin:
Particular | 2011 | 2010 | 2009 |
| Gross Profit | 559200398 | 4992392643 | 455662273 |
| Sales | 1695710571 | 1529918239 | 1386130532 |
| Total | 0.329773493 | 0.3264178635 | 0.328729699 |
Interpretation:
In the year 2008, 2009, 2010 the gross profit margin of Tamanna Ceramics Ltd. are respectively 0.328, 0.326, 0.329 which are higher than the industry average i.e. 0.329. As the gross profit margin by generating mare sales and managing the cost of goods sold.
Operating profit margin:
Measure the percentage of each sales dollar remaining after all costs and expenses other than interest, taxes and preferred stock dividends are deducted, the “Pure Profits” earned on each sales dollar.
Formula:
Operating Profit margin:
Particular | 2011 | 2010 | 2009 |
| Operating Profit | 471229138 | 408754864 | 375608183 |
| Sales | 1695710571 | 1529918239 | 1386130532 |
| Total | 0.27789479 | 0.26717431924 | 0.2709760548 |
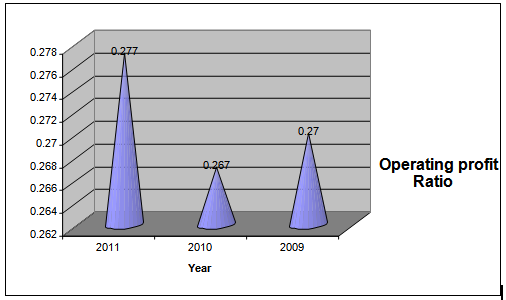
Interpretation:
In the year 2008, 2009, 2010 the gross profit margin of Tamanna Ceramics Ltd. are respectively 0.27, 0.267, 0.277 which are higher than the industry average i.e. So, the profitability of the company is satisfactory.
Net profit margin:
Measures the percentage of each sales dollar remaining after all costs and expenses, including interest, taxes and preferred stock dividends, have been deducted.
This is a widely used measure of performance and is comparable across companies in similar industries. The fact that a business works on a very low margin need not cause alarm because there are some sectors in the industry that work on a basis of high turnover and low margins, for examples supermarkets and motorcar dealers.
What is more important in any trend is the margin and whether it compares well
Formula:
Net Profit margin:
Particular | 2011 | 2010 | 2009 |
| Earning available for common stockholders | 172371934 | 17991587 | 130231324 |
| Sales | 1695710571 | 1529918239 | 1386130532 |
| Total | 0.1016517423 | 0.1175981712 | 0.093953146 |
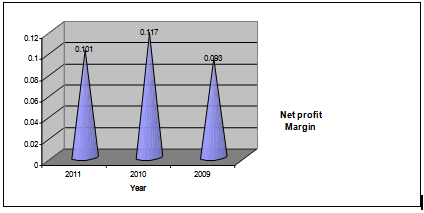
Interpretation:
In the year 2010, 2009 & 2008 the net profit margin of Tamanna Ceramic Ltd. are respectively 0.101, 0.147, 0.093 which are higher than the industry average i.e. – 10.16%. This means that company is successful to generate sufficient amount of profit.
Industry Analysis:
Tamanna Ceramics Ltd.
Industry Analysis (2011)
Ratio | Formula | Shinepukur Ceramics | Industry Average | Evaluation |
Internal Liquidity: | ||||
| Current Ratio | Total current assets/ Total current liabilities | 0.878 | 0.85 | Better |
| Quick Ratio | (Cash+Cash equivalent+Account)/ Total current assets | 0.252 | 0.35 | Ok |
| Cash Ratio | Cash+cash equivalent/ Total current assets | 0.014 | 0.06 | Better |
Receivable turnover | Net sales on credit / average account receivable | 5.56 | 13.42 | Worse |
Average receivable collection period | 360/Account receivable turnover | 64.69 | 45.45 | Worse |
Inventory turnover | Cost of goods sold / inventory | 1.33 | 1.26 times | Better |
Payable turnover | Cost of good sold / average trade payable | 11.15 | 11.94 | Ok |
Operating Performance: | ||||
Total assets turnover | Net sales / total assets | 0.19 | 0.77 | Worse |
Net fixed assets turnover | Net sales / Average fixed assets | 0.68 | 1.7 | Worse |
Gross profit margin | Gross profit/nets sales | 32.97% | 55.75% | Ok |
Operating profit margin | Operating income/net sales | 27.78% | 11.02% | Better |
Net profit margin | Net income/Net sales | 10.165% | 8.30% | Better |
Table no: 4.4
Sensitivity Analysis:
An approach for assassin risk that uses several possible return estimates to obtain a sense of the variability among outcomes.
Here we are analyzing the sensitivity of desiccation to be change in one or many condition. Suppose sales, cost of good sols & financial expenses are increased & decrease 20%.
Sensitivity Analysis of the company by increasing & decreasing the
Company’s net sales
Particular | 2011 | 20% increase in sale | 20% decrease in sale |
| Revenue from net sales | 1695710571 | 2034852685 | 1356568456 |
| Cost of Good Sold | 1136510173 | 1136510175 | 1136510173 |
| Gross Profit | 559200398 | 898342512 | 220058283 |
| Operating Expenses: | 87971260 | 87971260 | 87971260 |
| Administration Expense | 38302865 | 38302865 | 38302865 |
| Selling & distribution expense | 49668395 | 49668395 | 49668395 |
| Operating Profit: | 471229138 | 810371252 | 132087023 |
| Financial expense | (209672116) | (209672116) | (209672116) |
| Other Income | 88960 | 88960 | 88960 |
| Net Profit Before Contribution to WPWT | 261645982 | 600788096 | (77496133) |
| Contribution to workers participation | 12459333 | 12459333 | 12459333 |
| Net profit before tax: | 249186649 | 588328763 | (89955466) |
| Income tax expenses | 76814715 | 1764987628 | (26986639) |
| Net Profit After tax transferred to statement of change in equity: | 172371934 | 411830135 | 62968827 |
| EPS: | 2.05 | 2.33 | 2.20 |
Table no: 4.5
Tamanna Ceramics Ltd.
Profit & Loss Account
As a 31 December 2011 (Cost of Good sold)
Particular | 2010 | 20% increase in sale | 20% decrease in sale |
| Revenue from net sales | 1695710571 | 1695710571 | 1695710571 |
| Cost of Good Sold | 1136510173 | 1363812207 | 909208139 |
| Gross Profit | 559200398 | 331898364 | 786502432 |
| Operating Expenses: | 87971260 | 87971260 | 78471260 |
| Administration Expense | 38302865 | 38302865 | 38302865 |
| Selling & distribution expense | 49668395 | 49668395 | 49668395 |
| Operating Profit: | 471229138 | 243927104 | 698531172 |
| Financial expense | (209672116) | (209672116) | (209672116) |
| Other Income | 88960 | 88960 | 88960 |
| Net Profit Before Contribution to WPWT | 261645982 | 34343948 | 488948016 |
| Contribution to workers participation | 12459333 | 12459333 | 12459333 |
| Net profit before tax: | 249186649 | 33098015 | 476488683 |
| Income tax expenses | 76814715 | 99294045 | 142946604 |
| Net Profit After tax transferred to statement of change in equity: | 172371934 | (66196030) | 3335432078 |
| EPS: | 2.05 | 0.67% | 2.33 |
Table no: 4.6
Tamanna Ceramics Ltd.
Profit & Loss Account
As at 31 December 2011(Financial Expenses)
Particular | 2010 | 20% increase in sale | 20% decrease in sale |
| Revenue from net sales | 1695710571 | 1695710571 | 1695710571 |
| Cost of Good Sold | 1136510173 | 1136510173 | 1136510173 |
| Gross Profit | 559200398 | 559200398 | 559200398 |
| Operating Expenses: | 87971260 | 87971260 | 87971260 |
| Administration Expense | 38302865 | 38302865 | 38302865 |
| Selling & distribution expense | 49668395 | 49668395 | 49668395 |
| Operating Profit: | 471229138 | 471229138 | 471229138 |
| Financial expense | (209672116) | (251606539) | (167737692) |
| Other Income | 88960 | 88960 | 88960 |
| Net Profit Before Contribution to WPWT | 261645982 | 219711559 | 303580406 |
| Contribution to workers participation | 12459333 | 12454333 | 12459333 |
| Net profit before tax: | 249186649 | 207252226 | 291121073 |
| Income tax expenses | 76814715 | 62175667 | 873363321 |
| Net Profit After tax transferred to statement of change in equity: | 172371934 | 1450765458 | 203784751 |
| EPS: | 2.05 | 2.33 | 2.37 |
Table no: 4
Risk Analysis of Tamanna Ceramics Ltd.
Risk analysis examines the uncertainty of income for the firm and for an investor.
Total firm risks can be decomposed into two basic source:
- Business risk: The uncertainty in a firm’s operating income, highly influenced by industry factors.
- Financial risk: The added uncertainty in a firm’s net income resulting from a firm’s financing decisions (primarily through employing leverage).
- Liquidity Risk: It considers another aspect of risk from an investor’s
Business Risk:
Variability of the firm’s operating income over time. It can be measured by calculating the standard deviation of operating income over time or the coefficient of variation. In addition to measuring business risk, we want to explain its determining factors. Two primary determinants of business risk.
Sales variability
- The main determinant of earnings variability
Cost variability and operating leverage
- Production has fixed and variables costs
- Greater fixed production costs cause greater profit volatility with changes in sales.
- Fixed costs represent operating leverage
Greater operating leverage is good when sales are high and increasing, but bad when sales fall.
Business risks =
| 14.26% |
Operating Leverage
| 1.44 |
Financial Risk:
Interest payments are deducted before we get to net income, these are fixed obligations. Similar to fixed production costs, these lead to large earning during good times, and lower earnings during a business decline, fixed financing costs are called financial leverage. The use of debt financing is increasing financial risk and possibility of default while increasing profitability when sales are high. Two sets of financial ratios help measures financial risk
- Balance sheet ratios
- Earnings or cash flow available to pay fixed financial charges.
Acceptable levels of financial risk depend on business risk. A firm with considerable business risk should likely avoid lots of debt financing.
Proportion of Debt (balance sheet) Ratios:
Long-term debt can be related to equity (l-t D/Equity) how much debt does the firm employee in relation to its use of equity? And total capital [L-t D/(L-t D+ Equity)] How much debt does the firm employ in relation to all long-term sources of funds.
Debt to Equity Ratio=
2009 | 2010 | 2011 |
7.19 | 8.07 | 7.88 |
Total Long term capital ratio:
The formula of calculation is:
Debt to Equity Ratio=
2009 | 2010 | 2011 |
0.30 | 0.33 | 0.26 |
Total debt Ratio:
The formula of calculation is:
Total Debt Ratio=
2009 | 2010 | 2011 |
0.50 | 0.51 | 0.60 |
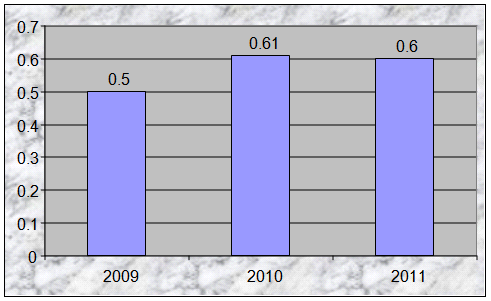
Comments:
In the year 2010 company’s debt ratio is 0.60 this value indicates that the company his financed more than half of its assets with debt. The higher this ratio greater the firms degree of indebtedness and the more finance leverage it has. In 2009 this ratio his increased to a level of 61% because the company has increase its capacity by buying some fixed assets which is from long term liability, not by issuing new share.
Earning Flows Ratio:
It is Relate operating income (EBIT) to fixed payments required from debt obligations, higher ratio means lower risk.
Interest Coverage or Times interest Earned Ratio Measures the number of times interest payments are “covered” by EBIT interest coverage = EBIT / Interest Expenses. May also want to calculate coverage ratios that reflect other fixed charges lease obligations (fixed charge coverage).
Interest Coverage =
2009 | 2010 | 2011 |
1.44 | 2.23 | 1.91 |
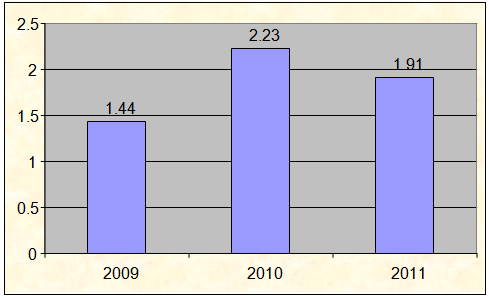
Comments:
A ratio of 2 is appropriate for the company, so we can see that the company is good at 2009, but not good enough in 2010 and 2011
Cash flow ratios:
Fixed financing costs such as interest payment musts be paid in cash, so these ratios use cash flow rather than EBIT to assess the ability to meet these obligations, relate the flow of cash available from operations to:
- Interest expense
- Total fixed expenses
- The face value of outstanding debt
Cash flow coverage of fixed financial
Cost =
2009 | 2010 | 2011 |
3.97% | 10.45% | 17.16% |
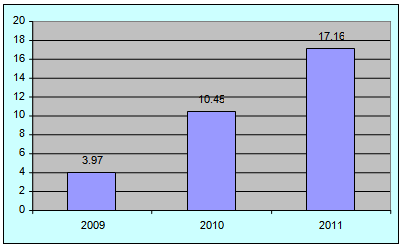
Comments:
Cash flow is used determine whether a borrower is going to be able to service interest payment on a loan. Generally lender prefers a cash flow ratio more than 1. Here we can see that the cash flow ratio of Tamanna Ceramics Ltd. in 2009 was 3.97 and it increase 10.45 in 2010. And decrease 2011 in 17.16%.
Liquidity Risk
Market liquidity is the ability to buy or sell an asset quickly with little price change from a prior transaction assuming no new information. External market liquidity is a source of risk to investors. The most important factor of external market liquidity is the dollar value of share traded. This can be estimated from the total market value of outstanding securities. It will be affected by the number of security owners. Numerous buyers and sellers provide liquidity.
DuPont system:
The DuPont system of analysis is used to dissect the firm’s financial statements and to assess its financial condition. It merges the income statement and balance sheet into two summery measures of profitability: return on total assets (ROA) and return on common equity (ROE).
The importance of ROE as an indicator of performance makes it desirable to divide the ratio into several components that provide insights into the causes of a firm’s ROE or any changes in it. This breakdown of ROE into component ratios is generally referred to as DuPont System.
To begin, the return on equity (ROE) ratio can be broken down into two ratios that we have discussed- net profit margin and equity turnover.
Net Income Net Income Net Sales
ROE= = x
Common Equity Net Sales Common Equity
This breakdown is an identity because have both multiplied and divided by net sales. To maintain the identity, the common equity value used is the year-end figure rather than the average of the beginning and ending value. This identity reveals that ROE equals the net profit margin times the equity more efficiency (increasing its equity turnover) or by becoming more profitable (increasing its net profit margin).
As noted previously, a firm’s equity turnover is affected by its capital structure. Specifically, a firm can increase its equity turnover by employing a higher proportion of debt capital. We can see this effect by considering the following relationship:
Net Sales Net Sales Total Assets
= x
Equity Total Assets Equity
Similar to the prior breakdown, this is an identity because we have both multiplied and divided the equity turnover ratio by total assets. This equation indicates that the equity turnover ratio equals the firm’s total asset turnover (a measure of efficiency) times the ratio of total assets to equity, a measure of financial leverage. Specifically, this latter ratio of total assets to equity indicates the proportion of total assets financed with debt. All assets have to be financed by either equity or some from of debt (either current liabilities or long-term debt).
Therefore, the higher the ratio of assets is equity, the higher the proportion of debt to equity.
Combining these two breakdowns, we see that a firm’s ROE is composed of three ratios as follows:
Net Income Net Income Net Sales Total Assets
= x x
Common Equity Net Sales Total Assets Common Equity
Year | Sales/ Total Assets (Times) | Net profit/ Sales | Return on Total Assets | Total Assets/Equity | Return On Equity |
2008 | 0.3068 | 9.39% | 4.26 | 2.96 | 1.26 |
2009 | 0.1771 | 11.59% | 4.04 | 1.88 | 7.57 |
2010 | 0.1859 | 10.16% | 3.71 | 1.87 | 6.95 |
Findings:
In this part we are going to discuss the findings of Tamanna Ceramics ltd. I observed the total financial operations very carefully and my findings are as follows:
- For analyzing the liquidity management of the company it can be used current ratio, quick ratio, cash ratio those are respectively 0.88, 0.252, and 0.012 which is above the industry average. The current liability of Tamanna Ceramics is rising tin the current asset. So we can say that the company is not only in a risky position but also facing financial distress and will unable to meet its short turn obligation in near future.
- By calculating inventory turnover ratio we can measure inventory management system of Tamanna Ceramic Ltd. It is very productive and maintains liquidity of its inventory in an efficient way that has directly affected the company’s profit. The industry average of the inventory turnover ratio is 1.26 times where as company’s inventory turnover ratio is 1.33.
- For calculating average receivable collection period it can be said that after making sales company have to wait more than 55 days that means the customer are not paying their bill in time and have not good control on its collection period. Because industry average of account receivable collection period is 46 days.
- Payment efficiency can be measured by payable turnover ratio which is 11.15. Comparing with industry average it can be said that company takes average time or paying the accounts payable.
For measuring the assets structure of company need to analysis total assets turnover ratio, net fixed assets turnover ratio. Which are bellowing the industry average Tamanna Ceramics Ltd does not have sufficient assets to support the financial operations?
- Organization is different on its financing strategy. Tamanna Ceramics Ltd. uses more debt than the other firm. For analyzing company’s financial strategy I used total debt ratio, debt to equity ratio.
Company has good profit margin. For calculating company’s earning I use gross profit margin ratio, operating profit margin ratio, net profit margin ratio which are 32.97%, 27.78%, and 10.165% which are above industry average.
- Cost of production increased due to increases in the price of raw materials chemicals and packing materials in the international market.
Conclusion:
During the three months dissertation program at TCL at Head Office, almost all the desks have been observed more or less. This internship program, in first, has been arranged for gaining knowledge of practical ceramics sector and to compare this practical knowledge with theoretical knowledge.
The Ceramics sector of Bangladesh is passing through a tremendous reform under the economic deregulation and opening up the economy. Currently this sector is becoming extremely competitive with the arrival of multinational ceramics company as well as emerging and technological infrastructure and higher performance level utmost customer satisfaction. As we all know in the business world hinges move on the will of impression. In spite of all limitations Tamanna Ceramics ltd still doing better and holding a good percentage of market shares in banking sector, only because of its best impression, performance and trust of its customers.
It is quite obvious that to achieve the desired goals of being fully compliant with the requirements for the regulated countries, the Bangladesh Government, or more specifically the ceramics Directorates would have to subscribe to some of these changes. They have an obligation to ensure high quality tableware product are produced for the domestic market but also products that are exported meet the international standards certainly a great deal of harmonization is need amongst the teaching institution, the trade associations and the government regulatory agencies, such as ceramics directorate to bring about this change.
For Bangladeshi ceramics firms to be successful in the US they would need to differentiate themselves to the relation by consistency of product and supply, distribution and logistics, capabilities and the pipe line of the future products. Probably the quickest and most economic way for the Bangladeshi companies to enter the regulated market is to develop alliance or partnership with US companies that are trying to maximize their development effort in a timely manner.
Recommendation for Tamanna Ceramics Limited:
I propose some recommendations for Tamanna Ceramics Ltd by observing the whole operation of the Organization. I can say that Tamanna ceramics ltd is quite good. I can recommend the following functions that can improve their position.
Tamanna limited should use more advertising camping to introduce their product to their Prospective customer.
Implement continuous monitoring system in the whole financial system by recovery process.
They must increase their proportion of asset than the liabilities. Because the current ratio of the Organization are decreasing day by day which I get from time series analysis.
Organization had to increase their sales for development though sales are increasing day by day but net profit margin and operating profit margin ratio is not satisfactory.
Organization can introduce new product line of improve quality product.
Organization should reduce their production cost to increase their profit because there gross profit margin ratio is not satisfactory.
Organization has satisfactory average collection period so it need to keep it up.
References
- Annual Report of Tamanna Ceramics Ltd.( 2011,2010,2009)
- Chief of Financial Management of Tamanna Limited.
- Principle of Financial Manager (10th Edition)- Lawrence J. Gitman
- Investment Analysis & Portfolio Management (6th Edition) – Frank K. Reilly & Keith Brown.
- Financial Statement Analysis (5th Edition) – Leopold A. Bernstein.
- www.tamannaceramic.com
- www.ceramicsindustry.com
- www.google.com
- Sharpe, William F., Alexander, Gordon J., Bailey V. (1978), “Investments” 6th edition, Published by Prentice, Hall India, USA.
- Zvi Bodie, Alex kane, Marcus, Alan J., (1989) “Investments” 6th edition, – Published by Tata mc Graw-Hill, USA.
- Edna, Carew, (1996) “The language of Money”, Published by Allen Cunwin, Australia.
- Raquib A. (2007) “Principle & Practice ”, (Panam Press Ltd, 12/13-A, Babar Road, Mohammadpur, Dhaka), pp-114-167.
- L. R. Chowdhury (1983), “A Texbook on Banker’s Advances”, (Fair Corporation, 139, Azimpur Road, Dhaka) pp-61-66, 293-306.
- A.A.M. Habibur Rahman (2001), (Helena Parveen Rina, 72/8/B/1 North Jatrabari, Dhaka) pp-158-195.
- Siddiqi (1983), M. N. “Economics of Profit-Sharing” In Z. Ahmed, M. Iqbal and M. F. Khan (eds.), Fiscal Policy and Resource Allocation in Islam. (Islamabad: Institute of Policy Studies) pp-68-69.