Vegetation surveys identify the plant species in each plot, the number of species present, and the percentage of total plot area covered by each species. The latter two are known as species diversity and percent cover.
Why do some places have more plant species than others? Why is there the greatest diversity in the tropics? What is the relationship between biodiversity and the environment? An international team led by researchers at the University of Göttingen has reconstructed the global distribution of plant diversity and made high-resolution predictions of where and how many plant species exist to help answer these questions. This will support conservation efforts, help to protect plant diversity, and assess changes in light of the ongoing biodiversity and climate crises. Their research was published in New Phytologist.
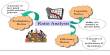
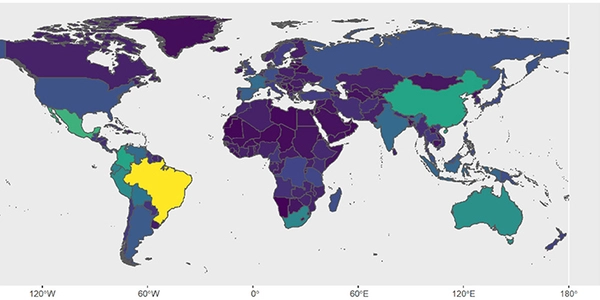
Researchers used modern machine learning techniques to model the relationship between plant diversity and environmental conditions using a unique global dataset of 830 regional floras and the distribution of 300,000 plant species compiled at the University of Göttingen over ten years.
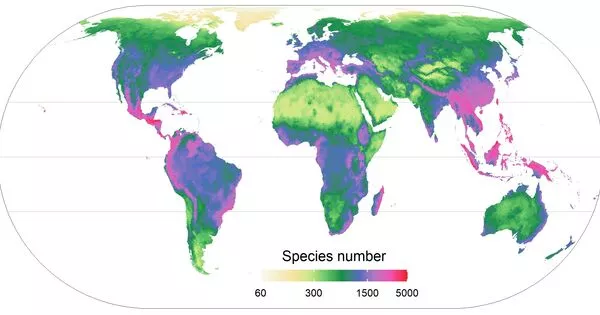
The global predictions show in unprecedented detail and accuracy how plant diversity is distributed across our planet. Knowing where to expect a certain number of species under current conditions allows researchers to assess future changes due to climate and land-use change, as well as identify impacts of overexploitation and introduced invasive species.
Professor Holger Kreft
They were able to take into account the evolutionary history of plants occurring in each geographic region by incorporating the relatedness of the species to one another. The models were then used to continuously predict plant diversity around the world, taking into account past and present geographic and climatic conditions.
The models capture how diversity varies along environmental gradients and help to identify global centers of plant diversity. Current climate and further environmental factors emerged as primary drivers of plant diversity. The highest concentrations of plant diversity are predicted in environmentally heterogeneous tropical areas like Central America, the Andes and Amazonia, South-East Brazil, parts of Tropical Africa, Madagascar, southern China, Indochina, and the Malay Archipelago as well as some Mediterranean regions like the Cape of Africa and locations around the Mediterranean Sea.
The models were created using modern machine-learning techniques and newly compiled plant distribution data. The global maps of plant diversity that result provide a solid foundation for large-scale biodiversity monitoring and research on the origins of plant diversity, as well as support for future global biodiversity assessments and environmental policies.
The loss and degradation of biodiversity have a negative impact on every level of the planet, particularly the poor and vulnerable: women, children, and indigenous people; thus, biological diversity is essential for humanity’s well-being.
“The global predictions show in unprecedented detail and accuracy how plant diversity is distributed across our planet,” says Professor Holger Kreft of the University of Göttingen’s Biodiversity, Macroecology, and Biogeography Group. “Knowing where to expect a certain number of species under current conditions allows researchers to assess future changes due to climate and land-use change, as well as identify impacts of overexploitation and introduced invasive species,” explains Dr. Patrick Weigelt of the University of Göttingen.