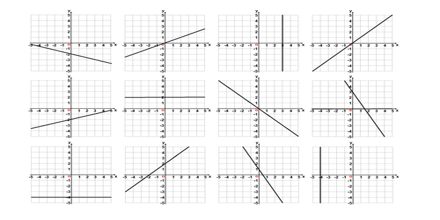
major objective of this lecture is to present on Graphs of Straight Lines. here briefly describe on how to graph equations and find equations from graphs. There are several ways to graph a straight line given its equation. line crosses the y-axis, b, called the y-intercept. when graphing, put this equation into “y = ” form to easily read graphing information. horizontal lines have a slope of zero – they have “run”, but no “rise” — all of the y values are 3.
Graphs of Straight Lines


