Financial Condition and Audit Procedure of
Square Toiletries Limited
Square Toiletries Ltd. (STL) is one of the largest and leading “Fast Moving Consumer Goods” company in Bangladesh. This report provides an in-depth analysis and interpretation of “Financial Condition and Audit Procedure – Square Toiletries Ltd. (STL)”. It consists of the job responsibilities I was given during my internship in the Finance and Accounts department of STL. A detail about my critical observation is given about the way they record their daily transactions with their third parties, the way they analyze and verify their every small to huge monetary transactions by auditing, the way they measure their production workers performance, and also how they maintain good relationship with their retailers through winter gift promotional campaign and etc., Then I also gave a description about my critical observation about the activities of STL including my recommendation to change some of their monitoring processes to increase revenue. Also, a detailed explanation of the profitability, liquidity and financial stability of STL over the last five years and its financial performance is compared to that of its competitor, Kohinoor Chemical Limited (KCL). This is done through liquidity, debt-management and profitability ratios. All these calculations were done with the help of balance sheet and income statement of STL for the last five years. For KCL, the calculations of ratios were done for the year of 2013 and 2014. Results of ratios are also discussed to evaluate STL’s overall performance and remedial actions are also given to overcome any major area of weaknesses. I have also explained a brief explanation about Internal Audit and Internal Control of Square Toiletries Ltd. in my report.
Objective of the Study
General Objective:
The objective of the study is to focus on one broad issue that is “Financial Condition and Audit Procedure – Square Toiletries Ltd.”. This paper also covers some other factors related to the finance and accounts functions of Square Toiletries Ltd. (STL) and its importance which mentioned in the specific objectives below:
Specific Objectives:
- To know about the financial management of Square Toiletries Limited.
- To know about the company’s mission, vision, objectives, values and principles.
- To know about the different brands of STL.
- To have a practical idea about the operations of finance and accounts department of STL.
- To analyze the strengths and weaknesses of the financial management of STL.
- To have an idea about the Internal Audit and Internal Control procedure of STL.
- To assess the performance of STL compared to its competitor, Kohinoor Chemicals Limited, through analyzing financial ratios.
Methodology of the Study
This report was prepared through a series of processes starting from selection of the topic to the completion of the report. I explained my experience as an intern in Square Toiletries Ltd. during these three months in this report. Along with it, I used the following methodology:
Selection of the Topic:
My supervisor helped me to selection this topic for my report so that I can come up with an informative and well-organized internship report.
Sources of Data:
Primary data:
I had several face- to-face discussions with my supervisor, executives of STL and with the General Manager regarding collection of information. Through my personal observation as an intern in STL, I got some information which I have used in this report.
Secondary data:
- Website of Square Toiletries Limited
- Annual reports of Square Toiletries Limited from the year 2010 to 2014
- Annual report of Kohinoor Chemicals Limited for the year 2013 and 2014
- Informative documents provided by the company supervisors
- Online search for more topic-related information
Introduction to the Square Group
Square Group is a local conglomerate of Bangladesh which started its journey with debut of Square Pharma as a Partnership Firm in 1958. With span of time, Square has emerged as one of the most admired local conglomerates which is showcasing its rampant march with other concerns along with Square Pharmaceuticals Limited.
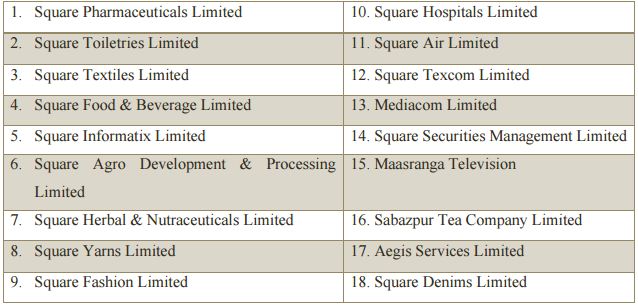
Concerns of Square Group
Reason behind Choosing Kohinoor Chemical Ltd. as the Competitor
Kohinoor Chemical Limited (KCL) is well-known by its most popular product “Tibet”. They are the pioneer amongst the soap, cosmetics and toiletries manufacturing industries of Bangladesh, producing highly value-added products. They are quality-focused. Here is a list of products of KCL which are direct competitive products of STL.
This is because KCL is considered to be the direct competitor of STL. Therefore, I have chosen this company for evaluating STL’s performance with one of its competitor KCL for peer analysis.
From the above table, we can see that Kohinoor Chemical Limited (KCL) is a direct competitor of Square Toiletries Limited (STL). This is because STL has almost all the brands that are provided by KCL. However, the number of products that are offered by STL under each brands are much higher than the products provided by KCL under each brands.
Financial Condition and Audit Procedure
Summary of the Analysis
This Project contains two (02) parts. These are,
- Financial Analysis.
- Internal Audit and Internal Control Procedure.
Financial Analysis: It contains an analysis where the ratios of Square Toiletries Limited are calculated for the last five (05) years (2010-2014) and compared with the ratios of Kohinoor Chemicals Limited (KCL). The report discloses liquidity, profitability and solvency ratios.
Internal Audit Procedure: It contains different aspects of performing an internal audit and how it is done. Also some basic guidelines for Internal Audit.
Internal Control: It also contains the benefits of Internal Control, Key Control Activities and Control Limitations.
Objective of the Analysis
- To know about the current financial situation of Square Toiletries Ltd.
- To know about the industry position of Square Toiletries Limited by analyzing its ratios of the last five (05) years (2010-2014) and compare it with its competitors for a clear picture.
- To learn how to implement different financial tools in real life analysis.
Methodology of the Analysis
In order to prepare this financial analysis part, only secondary data has been used. The sources that has been used to collect necessary data is given below:
- Financial Statements of Square Toiletries Limited for the year of 2010-2014 and Annual Report of Kohinoor Chemicals Limited for the year of 2013 and 2014..
- Websites of Square Group, Square Toiletries Limited and Kohinoor Chemicals Limited.
- Different journals and articles on Square Toiletries Limited.
- Other internship reports on Square Toiletries Limited.
- Different websites.
Financial Analysis Of Square Toiletries Ltd.
The real value of financial statements lies in the fact that they can be used to help predict a company’s financial position in the future and to determine expected earnings and dividends. An analysis of the company’s ratios is generally the first step in a financial analysis. The ratios are designed to show relationships between financial statement accounts within firms and between firms.
Sources for these ratios are the company’s financial statements within the industry that contains figures on assets, liabilities, profits and losses. Industry ratios are only meaningful when compared with other information. Since individual companies are most often compared with industry data, ratios help an individual to understand a company’s performance relative to that of competitors and are often used to trace performance over time.
There are 5 major categories when ratio analysis is considered. These categories are:
- Liquidity Ratio: This gives a picture of a company’s short term financial situation or solvency.
- Debt Management Ratio: It shows the extent that debt is used in a company’s capital structure.
- Profitability Ratio: It uses margin analysis and show return on sales and capital employed.
Liquidity Ratios
Liquid assets are assets that can be converted to cash without significant loss of its original value.
This basically indicates the strength of a company in terms of meeting the current obligations or liabilities, e.g. employee salary. Sometimes, low liquidity even leads to bankruptcy.
Two commonly used liquidity ratios are,
- Current Ratio and
- Quick Ratio.
Current Ratio
Current ratio is the ratio of current assets to current liabilities which refers to the short term solvency of the company and calculated as:
𝐶𝑢𝑟𝑟𝑒𝑛𝑡 𝑅𝑎𝑡𝑖𝑜 = 𝐶𝑢𝑟𝑟𝑒𝑛𝑡 𝐴𝑠𝑠𝑒𝑡𝑠/ 𝐶𝑢𝑟𝑟𝑒𝑛𝑡 𝐿𝑖𝑎𝑏𝑖𝑙𝑖𝑡𝑖𝑒𝑠
Analysis
Current ratio measures the short term debt paying ability of a company. In case of this ratio, the higher is the better. In this trend, we can see that they have the highest current ratio in 2010.
It gradually decreased in the next two years which is not a good sign for a company. But again in 2013 and 2014, it increased a bit higher. Last year means in 2014, the ratio stands in 1.08 which is higher than the benchmark point of 1. It means the company is able to meet its current liabilities by its assets. It has the ability to pay Tk. 1.08 to pay Tk. 1 of its liabilities.
Comparison
Compared to Kohinoor Chemical Limited (KCL). STL is below KCL. We can see in the trend line that the current ratio of KCL in 2013 and 2014 are 1.16 and 1.27 respectively which are much higher that what these are in STL. Therefore we can interpret that STL has an unfavorable current ratio but moreover both of the companies are maintaining a current ratio above 1 which shows that both of them are in a risk free stable position in the industry.
Quick Ratio
Acid test ratio is a better measure than current ratio as it deducts inventories from current assets and thus provides a better idea about the liquidity of the company. It is calculated as follows:
𝑄𝑢𝑖𝑐𝑘 𝑅𝑎𝑡𝑖𝑜 = (𝐶𝑢𝑟𝑟𝑒𝑛𝑡 𝐴𝑠𝑠𝑒𝑡𝑠 − 𝐼𝑛𝑣𝑒𝑛𝑡𝑜𝑟𝑖𝑒𝑠 − 𝑃𝑟𝑒𝑝𝑎𝑖𝑑 𝐸𝑥𝑝𝑒𝑛𝑠𝑒𝑠)/𝐶𝑢𝑟𝑟𝑒𝑛𝑡 𝐿𝑖𝑎𝑏𝑖𝑙𝑖𝑡𝑖𝑒𝑠
Analysis
It measures the immediate ability to meet its current dents. For quick ratio the higher is the better. In this case we can see in the trend line that they have the highest quick ratio in the year of 2010 (0.42). It was decreasing in the next two years which is not a good sign. In 2013 it increased its quick ratio a bit but again in 2014 it decreased to 0.23 which is less than 1. So, the company has only Tk. 0.23 to meet its Tk. 1 of current debts which indicates that the firm does not have sufficient cash to pay off its current debts.
Comparison
In the trend line of 2013 and 2014, we can see that STL was in lead over KCL as the quick ratio of KCL was way below than the ones of STL. It means that STL is in a strong position in comparison with KCL as STL have maintained a very promising ratio over the years. It indicates that, they are in a prime position to pay off their current debts with their current liquid assets at the moment. But still as both of the companies quick ratios are below the industry standard 1, proves that both of the companies should focus more on how they can meet their current liabilities with their quick assets efficiently.
Inventory Turnover:
The inventory turnover ratio is an efficiency ratio that shows how effectively inventory is managed by comparing cost of goods sold with average inventory for a period. This measures how many times average inventory is “turned” or sold during a period. A higher inventory turnover shows that the company can effectively sell the inventory it buys and does not wastes resources by storing non-salable inventory and therefore ensures better liquidity. It is calculated as:
𝐼𝑛𝑣𝑒𝑛𝑡𝑜𝑟𝑦 𝑇𝑢𝑟𝑛𝑜𝑣𝑒𝑟 = 𝐶𝑜𝑠𝑡 𝑜𝑓 𝐺𝑜𝑜𝑑𝑠 𝑆𝑜𝑙𝑑/𝐴𝑣𝑒𝑟𝑎𝑔𝑒 𝐼𝑛𝑣𝑒𝑛𝑡𝑜𝑟
Analysis
In case of inventory turnover, STL is maintaining a moderate ratio. Organization’s inventory turnover was on its highest level on 2010 and in the next two years it gradually decreased, which is not a positive sign. Still we can say that their sales in not that impressive at the moment to reduce its inventory level. From the trend above, it is seen that in 2014, STL’s inventory turnover was 4 times in that particular year. This means that the company is buying too much inventory and wasting the resources by storing the non-saleable inventory. So, the company is not effectively selling its inventories that it buys compare to the previous years. This will also effects in their net income.
Comparison
The trend shows that, STL possess average turnover ratios most of the years compared to its competitors. On the other hand, KCL is maintaining not a very impressive ratio its inventory turnover ratio for both of the last two years are around 2 times. The graph also shows a fluctuating trend of inventory turnover ratio over the years for STL. So, compared to KCL, STL’s inventory turnover is higher than that of KCL. Therefore, STL has a favorable inventory turnover ratio. This can if KCL has more unused inventories than STL.
Overall Performance Evaluation on Liquidity Ratio
Overall the liquidity position of STL is not in an efficient position, as current ratio and quick ratios needs to be improved. Current ratios has fallen during the last five years which is not a good sign but compared to 2013, it has increased a bit by which company can meet its current liabilities by its assets. Quick ratios has also went downwards over the past five years which indicates that the firm does not have sufficient cash to pay off its current debt.
Debt-Management Ratios
Debt management ratio judge the debt management performance of the company. If a company goes for too much debt for financing its operations, it might end up in a very hard financial situation.
Debt to Asset Ratio
The debt to total assets ratio measures the percent of total funds provided by creditors. Debt includes both current liabilities and long-term debt. It is calculated as:
𝐷𝑒𝑏𝑡 𝑡𝑜 𝑇𝑜𝑡𝑎𝑙 𝐴𝑠𝑠𝑒𝑡𝑠 𝑅𝑎𝑡𝑖𝑜 = 𝑇𝑜𝑡𝑎𝑙 𝐷𝑒𝑏𝑡/ 𝑇𝑜𝑡𝑎𝑙 𝐴𝑠𝑠𝑒𝑡𝑠
Analysis
The debt to assets ratio indicates the proportion of a company’s assets that are being financed with debt, rather than equity. The ratio is used to determine the financial risk of a business. A ratio greater than 1 shows that a considerable proportion of assets are being funded with debt while a low ratio indicates that the bulk of asset funding is coming from equity. From the trend line, we can see that STL is maintaining an average ratio of 0.63 over the last five years which is less than 1. It signifies that the company has more assets than debt.
Comparison
On the trend line we can see that KCL has an increased debt ratio in the last two years which are pretty close to 1. It is not a good sign in a sense that they are now relying more on their creditors for financing. On the other hand, STL is being quite good at this ratio however it can still be improved by keeping it closer to 0 and relying lesser on their creditors for financing.
Times Interest Earned
It indicates the ability to cover interest charges and tells us the number of times the interest is earned and calculated as:
𝑇𝑖𝑚𝑒𝑠 𝐼𝑛𝑡𝑒𝑟𝑒𝑠𝑡 𝐸𝑎𝑟𝑛𝑒𝑑 = 𝐸𝐵𝐼𝑇/ 𝐼𝑛𝑡𝑒𝑟𝑒𝑠𝑡 𝐸𝑥𝑝𝑒𝑛𝑠𝑒
Analysis
It measures how many times a company could pay interest expenses with its income. So in this case the higher ratio is more favorable than the lower one. And higher ratio is alos less risky than lower ratio. From the above analysis, we can see that the Times Interest Earned ratio of STL was 3.16 times in 2010. And in 2011, 2012, 2013 and 2014 it was 6.59, 8.63, 28.37 and 69.83 respectively which clearly shows an increasing trend. Last year the time interest earned ratio reached the highest point on 69.83 times compare to the previous years. This means STL’s income is 69.83 times greater than its annual interest expenses. It can also indicates that STL can afford to pay additional interest expenses.
Comparison
Compared to STL, KCL’s times interest earned ratio is significantly lower than STL. As we can see in the trend line that in 2014, KCL has got a very insignificant amount of times interest earned ratio. That means, KCL’s income is 3.37 times greater than its annual interest expenses.
It faces a pretty hard time to maintain its annual interest expenses. So, the banks will also find it problematic to sanction their loans as their affordability to pay its interest payments properly is not in a very good position. Therefore, STL has a favorable times interest earned ratio.
Overall Performance Evaluation on Debt-Management Ratio STL is in a favorable position overall in terms of debt-management ratios. However, debt to total asset ratio needs to be improved as it needs to be closer to 0 not closer to 1. On the other hand, it can be seen that time interest earned is in a good position as earnings before income tax is high due to increasing sales throughout the years.
Profitability Ratios
Profitability is the company’s ability to generate revenues in excess of the costs incurred in producing those revenues. Profitability ratio is the measure of performance showing how much the firm is earning compared to its sales, assets or equity.
Net Profit Margin on Sales
It measures profitability with respect to sales generated; net income per dollar of sales. That means, what percentage of sales are remaining after all expenses are paid by the business. It is calculated as:
𝑃𝑟𝑜𝑓𝑖𝑡 𝑀𝑎𝑟𝑔𝑖𝑛 𝑜𝑛 𝑆𝑎𝑙𝑒𝑠 = 𝑁𝑒𝑡 𝐼𝑛𝑐𝑜𝑚𝑒 / 𝑁𝑒𝑡 𝑆𝑎𝑙𝑒𝑠
Analysis
High profit margin ratio indicates that the company is managing well. On the above trend line we can see that the company has an increasing trend. It was struggling to achieve higher ratio on the 1st three years. Then in 2013 and 2014, it improved a lot more by earning more profit. In 2014, it reached to the highest on 0.06 which means the company is able to generate more revenues while keeping the expense constant.
Comparison
The trend shows that, KCL was also struggling to keep its profit margin ratio upwards. By the time of 2014, the ratio reached to 0.04. STL is seen to be in the most satisfactory situation compared to its competitor. It has been maintain a stable performance in the last two years as the rate is also higher in that. It is quite clear that KCL needs to pay more attention in increasing their sales and reducing the costs in order to compete and run their operations successfully.
Asset Turnover
Asset turnover ratio is an efficiency ratio that measures a company’s ability to generate sales from its assets. It is calculated as:
𝐴𝑠𝑠𝑒𝑡 𝑇𝑢𝑟𝑛𝑜𝑣𝑒𝑟 = 𝑁𝑒𝑡 𝑆𝑎𝑙𝑒𝑠 / 𝐴𝑣𝑒𝑟𝑎𝑔𝑒 𝐴𝑠𝑠𝑒𝑡𝑠
Analysis
It measures how efficiently a firm uses its assets to generate sales. Higher turnover ratios is always favorable because it means the company is using its assets more efficiently and is generating more revenues per dollar of assets. From the trend above, we can see that there is an increasing trend of total asset turnover over the years but it decreased in 2014 and reached to 2.30 which means each taka of STL’s assets generate Tk. 2.30 of sales.
Comparison
In comparison to its competitor, STL is in a good position in terms of asset as it is maintaining a turnover higher than “1” for past few years which indicates satisfactory asset management.
However, KCL also has a positive turnover ratio but still it can do further improvement as it is still lower than STL. Overall, the asset turnover of STL is good enough to compete. It is in a good position in case of generating revenues against each dollar of asset.
Return on Assets
Measures overall effectiveness in generating profits with available assets; earning power of invested capital. It is calculated as:
𝑅𝑒𝑡𝑢𝑟𝑛 𝑜𝑛 𝐴𝑠𝑠𝑒𝑡𝑠 = 𝑁𝑒𝑡 𝐼𝑛𝑐𝑜𝑚𝑒/𝐴𝑣𝑒𝑟𝑎𝑔𝑒 𝐴𝑠𝑠𝑒𝑡
Analysis
It measures how a company can manage its assets to make profits during a financial period. For this ratio, the higher one is more favorable because it indicates that the company is earning more money on its assets. A positive return on assets ratio shows an upward profit trend as well. On the other hand a low return on assets indicates an inefficient use of company’s assets.
From the above analysis, we can see that the return on assets of Square Toiletries Ltd. is in a good condition. It shows an increasing trend over the last five years. From 2010 to 2014. It gradually increased from 3.7% to 14.6% respectively. It means that the company is effectively managing its assets to generate greater amount of net income comparing to the previous years.
Comparison
Among the two (02) organizations, STL has higher return on assets. They had some decreased ratios in first three years but improved in 2013. Although the fluctuation margin is not that high but still a lot of improvement needs to be done. On the other hand, KCL’s trend shows that its performance is not that good but it is in a stable position in last two years. Overall in order to compete with other competitors, STL needs to be more effective in converting the money it has invested into net income.
Return on Equity
Measures earning power on shareholder’s book-value investment. It is calculated as:
𝑅𝑢𝑡𝑢𝑟𝑛 𝑜𝑛 𝐸𝑞𝑢𝑖𝑡𝑦 = 𝑁𝑒𝑡 𝐼𝑛𝑐𝑜𝑚𝑒/(𝐴𝑣𝑒𝑟𝑎𝑔𝑒 𝐶𝑜𝑚𝑚𝑜𝑛 𝑆𝑡𝑜𝑐𝑘ℎ𝑜𝑙𝑑𝑒𝑟′𝑠 𝐸𝑞𝑢𝑖𝑡𝑦)
Analysis
It measures firm’s ability to generate profits from its shareholders investments. For this ratio, the higher is the better. An investor wants to see a high Return on Equity ratio before investing in a company. Because it indicates that the company is using its investor’s funds effectively.
From the above trend, we can see that the return on equity of Square Toiletries Ltd. is in a good condition. It shows an increasing trend over the last five years. From 2010 to 2014, it means that the company is effectively utilizing its owner’s fund to generate profit compare to the previous years. This will attracts more investors as well. So the higher ratios are always better than the lower ones.
Comparison
The trend shows that in 2013, KCL had the highest return on equity over STL which was 108.5%. So, it generated the highest return from their shareholders’ equity. However on 2014, the game has changed. In 2014, STL had the highest return on equity over KCL which was 153.2%. Which means that STL is dominating in this ratio as they are generating higher return from shareholder’s equity.
Overall Performance Evaluation on Profitability Ratios.
The profitability ratio of STL is in efficient position according to the profit margin on sales, asset turnover, return on assets and return on equity ratio. The ratios show that it is increasing over the last five years which is a good sign and also it stands better than its competitor in the ratios. The asset turnover ratio has decreased in 2014 which shows that the rate of assets increased for STL more than the sales which caused the ratio to fall in the last year.
Internal Audit
Definition
An internal audit is a formal examination of the financial books and records of the component association to determine their accuracy and completeness, to detect and recommend correction of errors, and to assure the board and membership that the records are correct.
Certain Time of Performing an Internal Audit
All financial records shall be audited at the end of each year. In addition, the Board of Directors can request a special audit at any time, if demand necessary, and an audit should be performed when there is a change in financial officers.
People who can perform Internal Audit
An Audit Committee (consisting of at least 2 component association members) is appointed by the Board of Directors. An internal audit should be performed by an impartial person not related to the president or treasurer or any chairman handling funds and not by one authorized to sign checks.
Reasons for Performing Internal Audit
An audit should involve following all financial transactions through the records to be sure that receipts/bills have been properly accounted for and expenditures made us authorized by the Board of Directors and inconformity with the bylaws, policies and procedures, and budget limitations.
Adequate explanation of expenditures is confirmed so that it can be understood by anyone looking through the records.
Requirements to Perform Internal Audit
All of the financial records shall be provided by the treasurer for the audit, including the checkbook register, bank statements, canceled checks, deposit slips, treasurer’s reports, expense vouchers/warrants with bills/receipts, the annual treasurer’s report, etc. The treasurer should be available to answer any questions or help explain the organization of the financial records.
Internal Audit Policy and Procedure
An Internal audit is a formal examination of the financial books and records of the component association to determine their accuracy and completeness, to detect and recommend correction of errors, and to assure the board and membership that the records are correct.
- a) Policy:
All financial records shall be audited at the end if each year. In addition, the Board of Directors can request a special audit at any time, if deemed necessary, and an audit should be performed when there is a change in financial officers. The audit committee (consisting of at least 2 members) is appointed by the Board of Directors.
An internal audit should be performed by an impartial person not related to the president or treasurer or any chairman handling funds and, if possible, not by one authorized to sign checks.
- b) Procedure:
An audit should involve following all financial transactions through the record to be sure that receipts have been properly accounted for and expenditures made as authorized by the Board of Directors and inconformity with the bylaws, policies and procedures, and budget limitations. All of the financial records shall be provided by the treasurer for the audit, including the checkbook register, bank statements, canceled checks, deposit slips, treasurer’s reports, expense vouchers/warrants with bills/receipts, the annual treasurer’s report, etc. After the audit is completed, mark the ledger (if there is one) and the checkbook register by drawing a double line across the sheet where the audit concludes and sign and date, using different color ink, stating “Examined and found correctly”.
Basic Guideline for Internal Audit
- Identify Audit Committee Members.
- Choose a time and place for the internal audit and notify audit committee.
- Notify the treasurer to have all the records available for the audit committee and to be available for questions or to help explain the organization of the financial records.
- Have calculators available.
- Use the internal audit checklist as guide.
- Complete and sign the audit of the checking account balance sheet, this should be verified by at least two people.
- Complete and sign the internal audit report. This should be presented at the next board meeting. List any errors found or corrections made. It is not necessary to list details you have added to make explanations more complete. The entire audit committee should sign this report.
- After the audit is completed, mark the ledger (if there is one) and the checkbook register by drawing a double line across the sheet where the audit concludes and sign and date, using different color ink stating “Examined and found correct by ____________ (name) _______ on ______ (date) ____.”
- Keep all audit paperwork with the financial records that were audited. Send a copy of the Balance Sheet and Internal Audit Report to the AAMT office and your component board partner.
- The minutes should reflect that an audit (internal or external) has been done
Internal Audit Checklist
Warrants/Vouchers
- Written for all checks, including voided checks.
- Amount on check matches amount on warrant/voucher.
- Adequate explanation for all expenditures.
Receipts/Bills
- The amount on the receipt/bill matches the amount on the check.
- Receipts or bills for every check written.
- Written and signal explanation for any missing receipts/bills.
Checks/Disbursements
- No missing checks.
- Voided checks saved.
- All checks recorded in check register.
Bank/Reconciliation
- No missing bank statements.
- Ending balance agrees with last bank statement (adjusted for outstanding checks and deposits not posted to bank statement).
- Bank charges and interest recorded in check register.
Income
- Income received matches deposits.
- Detailed record of all income received.
- All deposits recorded in check register
Internal Control
Definition
Internal control is a process designed by an organization’s governing board to provide reasonable assurance regarding the achievement of objectives in the following categories:
- Effectiveness and efficiency of operations
- Reliability of financial reporting
- Compliance with applicable laws and regulations
The definition reflects certain fundamentals concepts:
- Internal control is a process. It is a means to an end, not an end in itself.
- Internal control is effected by people. It is not merely policy manuals and forms, but people functioning at every level of the institution. All personnel are responsible to communicate problems in operations, deviations from established standards, and violations of policy or law.
- Internal control is geared to the achievement of objectives in several overlapping categories.
- Internal control can be expected to provide only reasonable assurance to an organization’s leaders regarding achievement of operational, financial reporting, and compliance objectives. It is not absolute assurance.
Benefits of Internal Control
Internal controls help prevent errors and irregularities from occurring. If errors or irregularities do occur, internal control will help ensure they are detected in a timely manner.
Internal controls encourage adherence to prescribed policies and procedures.
Internal controls protect employees:
1) By clearly outlining tasks and responsibilities,
2) By providing checks and balances, and
3) From being accused of misappropriations, errors or irregularities
Key Control Activities
Segregation of Duties:
Duties are divided, or segregated, among different people to reduce the risk of error or inappropriate actions. For example, responsibilities for receiving cash or checks, preparing the deposits to the Cashier’s office, and reconciling the deposit to the cashier’s receipt and Balances should be separated.
Structure:
Organizational structure – lines of authority and responsibility – should be clearly defined so that employees know where to go to report performance of duties, problems and questions related to position and the organization as a whole. An organization chart is a good means of defining this structure as long as it is kept up to date. Part of the structure is also the rules that employees must abide by. Written policies and procedure provide guidance to employees in carrying out their duties, provide for clear rules on allowable and expected activity, as well as provide means for enforcement. The department’s lines of authority and policies and procedures should be reviewed periodically to ensure they are in agreement with the organization’s strategic mission.
Authorization and approval:
Transactions should be authorized and approved to help ensure the activity is consistent with departmental or institutional goals and objectives. For example, a department may have a policy that all purchase requisitions and invoice vouchers must be approved by the director.
The important thing is that the person who approves transactions must have the authority to do so and the necessary knowledge to make informed decisions.
Reconciliation and review:
Performance reviews of specific functions or activities may focus on compliance, financial or operational issues. Reconciliation involves comparing transactions or activity recorded to other sources to help ensure that the information reported is accurate. For example, revenue and expense activity recorded on accounting reports should be reconciled or compared to supporting documents to ensure that the transactions are recorded timely, in the correct account, and for the right amount.
Security:
Security may be physical or electronic (information system controls) or both. Equipment, inventories, cash, checks and other assets should be secured physically, and periodically counted and compared with amounts shown on control records. For example, the periodic physical confirmation of equipment by individual departments is a physical security control.
Virus detection software should be current and updated regularly to help protect integrity of system. Hardware and access controls (passwords) should be changed periodically and rigorously safeguard to protect from unauthorized access to database, computer system, etc. special physical and software controls issue (such as encryption software) should be developed for systems containing sensitive and/or confidential information.
Control Limitations
Internal controls, no matter how well designed and operated, can provide only reasonable assurance regarding the achievement of objectives. The concept of reasonable assurance recognized the cost of internal controls should not exceed the benefits derived and also recognizes evaluation of these factors requires estimates and judgment by management. For objectives related to the effectiveness and efficiency of operations, internal control can only help to ensure management is aware of the entity’s progress or lack of it.
Limitations which may hinder the effectiveness of an otherwise adequate system of internal controls include:
- Resource constraints
- Inadequate skill, knowledge or ability
- Degree of motivation by management and employees
- Faulty judgments
- Unintentional errors
Additionally, controls can be circumvented by collusion of two or more people. Even more important to recognize, management has the ability to override the internal control system.
These factors, combined with changing needs and personnel, make it risky to project any evaluation of internal control to future periods. On an ongoing basis, management must evaluate business risks and the controls needed to manage those risks and keep existing controls effective.
Management evaluation generally leads to periodic adjustments and corrective action, which also helps assure the continuing effectiveness of the internal control system.
Flowchart example of how internal control is ensured in STL
Case:
On the period of my internship, there was a problem occurred when few cartons of “Meril splash beauty soap” were returned from a retail store. The reason behind this was the barcodes on the packages of those products were not readable. And the barcode reader could not read those barcodes and entry those products into their database. I was assigned with one of the auditors to figure out few alternatives and to come up with a possible cost minimizing solution for this problem. We brainstormed the problem and found out that the problem was occurring because of bad packaging. The packaging overlapped the barcode on the product.
After finding the reason of the problem, we initially thought of three alternative solutions to think over. Those were,
- Reject or ignore those products.
- Packaging those products with new packages.
- Attaching printed new barcode stickers over the old packages.
After that we go through a flow chart to find out which of these alternatives is the most preferable to minimize the cost.
Recommendations
Improving Liquidity Ratios: From the liquidity ratios, both the current and quick ratio shows a declining trend in the year 2014. This has to be improved because lower the value of current ratio, lower is the margin of safety that the company possesses to cover short-term obligations.
However, current ratio may provide a misleading indication of a company’s liquidity position because the quality of each individual asset is not taken into account while computing this ratio. This means that a company with high current ratio may not always be able to pay its current liabilities as they become due if a large portion of its current assets consists of slow moving or obsolete inventories (illiquid). Therefore, quick ratio needs to be given more importance because it considers only the most liquid assets and gives a true indication of liquidity.
Improving Profitability Ratio: Total asset turnover ratios is seen to have a fluctuating trend over the years. The firm could be holding obsolete inventory and not selling inventory fast enough. With regard to accounts receivable, the firm’s collection period could be too long and credit accounts may be on the books too long. Fixed assets, such as plant and equipment, could be sitting idle instead of being used to their full capacity. All of these issues could lead to a fluctuating total asset turnover ratio. Therefore, STL have to carefully manage their assets in order to have a high net sales throughout the years.
Increasing the number of People in the Internal Audit Team of STL: As I have mentioned earlier that the audit team of Square Toiletries Ltd. has to perform audit for seven (07) sister concerns of Square Group which is quite difficult to maintain for a three people audit team.
Because audit team has to verify every little to big transactions made by these concerns and sometimes it takes a very long time to actually be able to perform an audit properly. So, they should consider hiring more qualified people to distribute the work evenly so that number of mistakes can be reduced and the verifying time of a transaction can be quicker.
Conclusion
Upon analyzing the general financial management of Square Toiletries Limited, it was seen that Square Toiletries Limited is the country’s leading manufacturer of international quality brand with huge number of diversified products. For effective sales management, STL follows the accrual basis accounting and records it in their vouchers. Also analyzing their financial performance, we found out whether STL will stay solvent and remain in business. This was done by comparing ratios over time for same company and over time for the company compared with its peer group, KCCL. In most of the cases, their efficiency, solvency and activity ratios showed an increasing trend over the last five years while their liquidity ratios showed a fluctuating trend over the last five years. However, from the ratios it was seen that Liquidity and Debt-Management ratios need to be improved if the company wants to reduce their level of obligations. Finally, I can say that general financial management practice of Square Toiletries Limited is otherwise very efficient and the weaknesses are to be addressed with effective solution. This way Square Toiletries Limited can uphold its position as a business icon.