ABSTRACT
Spontaneous intracerebral hemorrhage comprises 10-15% of all strokes. The aim of the study was to assess the relation between the ICH score and the surgical outcome of intracerebral hemorrhage by Glasgow Outcome Scale at the 30th post ictus day.
A prospective study was done during April 2009 to October 2010 in Department of Neurosurgery, BSMMU, Shahbagh, Dhaka. 43 cases were selected by criteria. ICH sore was calculated during admission and the surgical outcome of intracerebral hemorrhage was determined by Glasgow Outcome Scale by face to face interview or by structured interview over phone at their 30th post ictus day.
Correlation between the ICH score and the surgical outcome of intracerebral hemorrhage was done by Pearson’s correlation coefficient test. Value of r was found -0.635 which was statistically very significant (p=.001) and the relation was found negative. Higher ICH score had unfavorable outcome.
The ICH score is a simple clinical grading scale that allows risk stratification of patients with ICH. As correlation between the ICH score and the surgical outcome of intracerebral hemorrhage was found statistically very significant it can be use widely as a grading scale in preoperative counseling. The use of ICH score could improve standardization of clinical treatment protocols and clinical research studies in ICH.
Background of the study
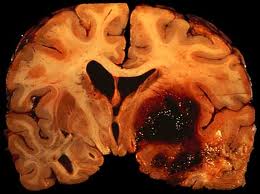
Spontaneous Intracerebral hemorrhage (ICH) is defined as bleeding into brain parenchyma without accompanying trauma. It occurs with an incidence estimated to range from 15 to 35 cases per 100,000 people per year. Each year, approximately 37,000 to 52,000 people in the United States have an ICH. The rate is expected to double during the next 50 years as a result of the increasing age of the population and changes in racial demographics (Aghi et al 2006).
Depending on underlying causes of bleeding, ICH is classified as either primary or secondary. Primary ICH accounting for nearly 80% of all cases, originates from the spontaneous rupture of small vessels damaged by chronic hypertension or amyloid angiopathy. Secondary ICH occurs in a minority of the patient associated with vascular abnormality, tumor, cerebral infarction, impaired coagulation (Aghi et al 2006).
Initial evaluation is typically through a CT scan, which is rapid and easily demonstrates ICH as hyperdence area with in brain parenchyma with a value of 50-80 Hounsfield units. CT demonstrates the location, the size as well as the volume of hematoma. CT also shows clearly the degree and the extent of midline shift, the presence of intraventricular hemorrhage, evidence of herniation as well as associated hydrocephalus (Jha 1996).
Clinical grading scales play an important role in the evaluation and management of patients with acute neurological disorders. Examples of widely used clinical grading scales include the GCS for traumatic brain injury, the Hunt-Hess and World Federation of Neurological Surgeons (WFNS) scales for aneurysmal SAH, the National Institutes of Health Stroke Scale (NIHSS) for ischemic stroke (Brott et al 1889) and the Spetzler-Martin scale for AVM (Spetzler & Martin 1986). However, despite the common occurrence and high morbidity of ICH, there remains no widely used clinical grading scale for ICH. Most of the existing models use complex algebraic equations in outcome prediction and none have been simplified into a standard clinical grading scale analogous to the GCS, NIHSS, Hunt-Hess, WFNS or Spetzler-Martin scales. It is likely that this lack of a uniform ICH scale has contributed to variability in enrollment criteria for ICH studies as well as to heterogeneity in clinical ICH care. To be generally applicable, a clinical grading scale must be simple enough to use without significant special training, statistical knowledge or extensive time commitment. The intracerebral hemorrhage score (ICH score) is now a standard neurological assessment tool that is reproducible and reliable (Hemphill et al 2001).
In 2001 Hemphill et al. in their retrospective study found that each increase in the ICH Score was associated with a progressive increase in 30-day mortality (P-0.005). Thirty-day mortality rates for patients with ICH Scores of 1, 2, 3, and 4 were 13%, 26%, 72%, and 97%, respectively.
In 2003 Godoy et al. applied the ICH Score to their Argentinean population. In their population thirty-day mortality rates for patients with ICH Scores of 1, 2, 3, and 4 were 6.6%,34%, 56%, 70% respectively showed progressive increase in mortality rates when the ICH Score increases.
In 2003 Jamora et al. applied the ICH Score prospectively to their Asian population which represents an ethnically and culturally distinct group of patients. 30 day mortality of their study of ICH score 1, 2,3,4 was 8%,12%, 75%,68% respectively and functional outcome at discharge for ICH score 1 was 78% and 82% for ICH score 2 and for ICH score 3,4 ,5 was 100% by 2 modified Rankin Score ≥4.
In 2004 Clarke et al. did a retrospective study to do the Validation of the ICH Score and found that overall 30-day mortality was 40%. Thirty-day mortality rates for patients with ICH scores of 1, 2, 3, and 4 were 13%, 39%, 78%, and 96% respectively.
In 2006, Godoy et al. showing that, at the 6-month follow-up, the ICH Score could predict not only mortality, but also the better functional outcome (GOS 4 to 5). Thirty-day mortality rates for patients with ICH scores of 1, 2, 3, and 4 were 2.9%, 30.8%, 61.1%, 88.2% respectively. At 6 months after ICH 34.6% were dead, 38.6% had good outcome (GOS 4 to 5) and 22.8% were live with significant impairment (GOS 2 to 3).
The reason to validate a clinical grading scale in a group of patients distinct from that used to develop the scale is to ensure that the scale can be applied widely. These studies demonstrated that the ICH score is valid suggesting that it had wide applicability and it is related with 30 day mortality and morbidity.
RATIONALE
Intracerebral hemorrhage constitutes 10% to 15% of all strokes and has a higher risk of morbidity and mortality (40-45%). Because of high mortality and morbidity proper preoperative counseling is essential and very important regarding patient management. The intracerebral hemorrhage score (ICH Score), which has wide validity, can predict the surgical outcome of ICH in terms of mortality and morbidity. The aim of the study was to see the relationship between ICH score and surgical outcome of ICH.
HYPOTHESIS
Surgical outcome of spontaneous intracerebral hemorrhage is related with the intracerebral hemorrhage score.
AIMS AND OBJECTIVES
AIMS:
To see the correlation between intracerebral hemorrhage score and surgical outcome of spontaneous intracerebral hemorrhage.
OBJECTIVES:
General Objective:
– To assess the relationship between intracerebral hemorrhage score (ICH score) and surgical outcome.
– To assess the significance of intracerebral hemorrhage score (ICH score) in prognosis of spontaneous intracerebral hemorrhage surgery.
Specific Objective:
– To see the effect of volume of hematoma on surgical outcome.
– To see the association between intraventricular extention of hemorrhage and surgical outcome.
– To compare the surgical outcome between supratentorial and infratentorial hemorrhage.
– To assess the relationship between presenting GCS and surgical outcome.
RELATED PREVIOUS STUDIES
Intracerebral hemorrhage (ICH) constitutes 10% to 15% of all strokes and remains without a treatment of proven benefit. Despite several existing outcome prediction models for ICH, there is no standard clinical grading scale for ICH analogous to those for traumatic brain injury, subarachnoid hemorrhage, or ischemic stroke. Hemphill et al. did a retrospective study where records of 152 patients with acute ICH presented to the University of California, San Francisco during 1997–1998 were reviewed. Independent predictors of 30-day mortality were identified by logistic regression. A risk stratification scale (the ICH Score) was developed with weighting of independent predictors based on strength of association. Factors independently associated with 30-day mortality were Glasgow Coma Scale score (P < 0.001), age ≥ 80 years (P =.001), infratentorial origin of ICH (P=.03), ICH volume (P=.047), and presence of intraventricular hemorrhage (P=.052). The ICH Score was the sum of individual points assigned as follows: GCS score 3 to 4 (=2 points), 5 to 12 (=1), 13 to 15 (=0); age ≥80 years yes (=1), no (=0); infratentorial origin yes (=1), no (=0); ICH volume ≥ 30 cm3 (=1), , < 30 cm3 (=0); and intraventricular hemorrhage yes (=1), no (=0). All 26 patients with an ICH Score of 0 survived, and all 6 patients with an ICH Score of 5 died. Thirty-day mortality increased steadily with ICH Score (P< 0.005). The ICH Score is a simple clinical grading scale that allows risk stratification on presentation with ICH. The use of a scale such as the ICH Score could improve standardization of clinical treatment protocols and clinical research studies in ICH.
Fernandes et al. in 2002 did a prospective study in Department of Neurosurgery University of Newcastle, United Kingdom from 1994 to 2002; all patients admitted following a spontaneous supratentorial ICH had been recorded on a prospective database and followed up to 6 months after ictus. Although they did not do mortality at 30 days, they recorded outcome at neurosurgical discharge, which was on average 2 to 4 weeks after ictus. Up to August 1999, 440 patients have been entered. Data were missing on 47 patients, not allowing a score to be calculated, but the remaining 393 patients were scored. A single patient scored 6 (< 1%), 17 scored 4 (4%), 74 scored 3 (19%), 116 scored 2 (30%), 97 scored 1 (25%), and 88 patients scored 0 (22%). They also found 100% mortality in patients scoring 5 or 6 (although this was only 1 patient) but 5% mortality with a score of 0 or 1. They were also interested to see whether this scoring system could predict unfavorable outcome (severe disability, death, or vegetative state) at neurosurgical discharge. It was apparent that for all patients scoring above 2, the rate of unfavorable outcome approached 100%. In fact, 38% of patients with a score of 0 and 70% with a score of 1 were not independent at neurosurgical discharge.
Jamora et al. in 2003 did a prospective study in the Philippines at the Philippine General Hospital and St Luke’s Medical Center on 302 patients with spontaneous ICH. Data on 30-day mortality and modified Rankin scale (MRS) were completed in only 243 patients. Infratentorial hemorrhage accounted for 12% in their cohort. Yet none of our patients scored 6. Only 3 patients scored 5 (1%), 18 scored 4 (7%), 28 scored 3 (12%), 52 scored 2 (21%), 70 scored 1 (29%), and 72 scored 0 (30%). Overall 30-day mortality in their study was only 23%. They found the score to be predictive of poor functional outcome (MRS ≥ 4) at discharge and even more so at 30 days after discharge. This was in contrast to the results of Fernandes and coworkers who did not find the ICH score to be as helpful in this aspect maybe because they evaluated outcome too early at discharge without accounting for the eventual improvement in function over time. They found MRS ≥ 4 for ICH score 0,1 and 2 is 45%,78% and 82% at discharge and 32%,50% and 70% 1 month after discharge.
In 2003 Godoy et al. applied the ICH Score to their Argentinean population. In their population thirty-day mortality rates for patients with ICH Scores of 1, 2, 3, and 4 were 6.6%,34%, 56%, 70% respectively showed progressive increase in mortality rates when the ICH Score increases.
In 2004 Clarke et al. did a retrospective study of 175 patients to do the Validation of the ICH Score during January 1, 1998 and December 31, 2000 and found that overall 30-day mortality was 40%. Thirty-day mortality rates for patients with ICH scores of 1, 2, 3, and 4 were 13%, 39%, 78%, and 96% respectively.
In 2006, Godoy et al. showed that, at the 6-month follow-up, the ICH Score could predict not only mortality, but also the better functional outcome (GOS 4 to 5). Thirty-day mortality rates for patients with ICH scores of 1, 2, 3, and 4 were 2.9%, 30.8%, 61.1%, 88.2% respectively. At 6 months after ICH 34.6% were dead, 38.6% had good outcome (GOS 4 to 5) and 22.8% were live with significant impairment (GOS 2 to 3).
Patriota et al. 2009 did another prospective study in Hospital do Servidor Publico Estadual de São Paulo, São Paulo, Brazil, between January 1, 2006 and October 31, 2006 of 37 patients. The aim of the study was to assess the ICH Score, a simple and reliable scale, determining the 30-day mortality and the one-year functional outcome. Overall, 30-day mortality was 37.83% and did not differ from the one-year mortality. The ICH Score was an accurate predictor of outcome, assessed as 30-day mortality. Thirty-day mortality rates for patients with ICH Scores of 0, 1, 2, 3, and 4 were 11.11%, 12.5%, 44.44%, 70% and 100%, respectively, showing a progressive increase in 30-day mortality (p<0.05). Twelve months after SICH, 14 (37.83%) patients had died, 14 (37.83%) presented a better functional outcome (GOS 4 to 5), and 9 (24.32%) were alive, but presented significant impairment (GOS 2 to 3). Better functional outcome (GOS 4, 5) rates for patients with ICH Scores of 0, 1, 2, 3 and 4 were 66.66%, 50%, 33.33%, 10% and 0%, respectively. Worse functional outcome (GOS 2, 3) rates for patients with ICH Scores of 0, 1, 2, 3 and 4 were 22.22%, 37.5%, 22.22%, 20 and 0%, respectively.
ANATOMY
The brain lies in the cranial cavity and is continuous with the spinal cord through the foramen magnum. It is surrounded by three meninges: the dura matter, the arachnoid matter, the pia matter; and these are continuous with the surrounding meninges of the spinal cord. The cerebrospinal fluid surrounds the brain in the subarachnoid space. The brain is conventionally divided into three major divisions. These are, in the asending order form the spinal cord, the hind brain, the midbrain, the forebrain. The hind brain may be subdivided into the medulla oblongata, the pons, and the cerebellum. The fore brain may be also be subdivided into the diencephalons (between brain), which is the central part of the forebrain, and the cerebrum. The brain steam (a collective term for the medulla oblongata, pons, and midbrain) is that part of the brain that remains after the cerebral hemispheres and cerebellum are removed (Snell 2006).
The cerebrum is the largest part of the brain and is situated in the anterior and the middle cranial fossae of the skull occupying the whole concavity of the vault of the skull. It may divide into two parts: the diencephalons, which forms the central core, and the telencephalon, which forms the cerebral hemisphere. The diencephalons can be divided in to four major parts: (1) the thalamus (2) the subthalamus (3) the epithalamus, and (4) the hypothalamus. The cerebral hemispheres are the largest part of the brain and are separated by a deep midline sagittal fissure, the longitudinal cerebral fissure. The fissure contains the sickle-shaped fold of dura matter, the falx cerebri, and the anterior cerebral arteries. In the depth of the fissure, the great commissure, the corpus callosum, connects the hemispheres across the midline. A second horizontal fold of dura matter separates the cerebral hemispheres from the cerebellum and is called the tentorium cerebelli. Cerebral cortical surfaces are divided into frontal, patietal, temporal and occipital lobes by the central, parieto-occipital, lateral and calcarine sulci ( Snell 2006).
The cerebral hemispheres are covered with a layer of gray matter, cerebral cortex. Located in the interior of the cerebral hemispheres are the lateral ventricles, masses of gray matter, the basal nuclei, and nerve fibers. The nerve fibers are embedded in the neuroglia and constitute the white matter. The term basal nuclei are applied to a collection of masses of gray matter situated within each cerebral hemisphere. They are the corpus straitum, the amygdaloid nucleus, and the claustrum(Snell 2006).
Cerebral blood supply:
The arterial supply of the brain is derived from the internal carotid and vertebral arteries which lie in the subarachnoid space. The vertebral and basilar arteries give branches to the spinal cord, the brainstem, and the cerebellum, the basilar artery ending at the upper border of the pons by dividing into the two posterior cerebral arteries. The internal carotid artery divides at its end into anterior and middle cerebral arteries; the anterior are interconnected by anterior communicating artery. Just before its end the internal carotidl artery connects via the posterior communicating artery with the posterior cerebral artery, completing a vascular circle, the circulus arteriosus, around the interpeduncular fossa. It should appreciated that although the circulus arteriosus offers a potential shunt in abnormal condition, such as during an occlusion or spasm, in normal circumstances it is not an equalizer and distributor of blood from different sources. From the circulus arteriosus, or vessels near it, central branches arise to supply the interior of the cerebral hemisphere and the thalamus. These vessels form six principal groups:
1) the anteromedial group, from the anterior cerebral and anterior
communicating arteries.
2) the posteromeidal group, from the posterior cerebral and posterior communicating arteries.
3) and 4) the right and left anterolateral groups, from the middle cerebral arteries.
5) and 6) he right and left posterolateral groups, from the posterior cerebral arteries(Williams and Dyson 1989).
The entire blood supply of the cerebral cortex comes from cortical branches of the anterior, middle, and posterior cerebral arteries, which reach the cortex in the pia mater. They divide in its substance, have branches penetrating the cortex perpendicularly and are divisible into long and short rami. The long and medullary arteries traverse the cortex and penetrate the subjacent white matter for 3 or 4 cm without communicating and thus form many independent systems. The short arteries are confined to the cortex, forming with the long vessels a compact network in the middle zone of the gray matter, the outer and inner zones being sparing supplied. Vessels of the cortex are not so strictly ‘terminal’ as those in the white matter or central system but, although adjacent vessels anastomose on the surface of the brain, they become end arteries as soon as they enter it. Owing to the cellularity of the gray matter, its blood supply is more copious than that of white matter (Williams and Dyson 1989).
The lateral surface of the hemisphere is mainly supplied by the middle cerebral arteries; a strip next to the superomedial border as far back as parieto-occipital sulcus is supplied by the anterior cerebral artery; the occipital lobe and the most of the inferior temporal gyrus ( excluding the temporal pole) is supplied by the posterior cerebral artery. Medial and inferior surfaces are supplied by the anterior, middle, and posterior cerebral arteries, the area supplied by the anterior extending almost to the parieto-occipital sulcus and including the medial part of the orbital surface. The rest of this surface and the temporal pole are supplied by the middle cerebral artery. The remaining medial and inferior surface is supplied by the posterior cerebral artery. Most of the corpus straitum and the internal capsule is supplied by the middle and lateral straite rami of the middle cerebral artery’s central branches, the rest being supplied by central branches of the anterior cerebral artery. One ramus of the middle cerebral artery, usually the largest, was termed by Charcot ‘The artery of cerebral hemorrhage’ (Williams and Dyson 1989).
PREDISPOSING FACTOR
Depending on underlying cause of bleeding, ICH is classified as either primary or secondary. Primary ICH accounting for nearly 80% of all cases, originates from the spontaneous rupture of small vessels damaged by chronic hypertension or amyloid angiopathy, more commonly the former. Secondary ICH occurs in a minority of the patient with ICH in association with vascular abnormality, tumor, cerebral infarction, impaired coagulation. Secondary ICH from vascular abnormalities should always be investigated as a possible source because of the high risk of recurrent hemorrhage and the necessity of surgical or endovascular treatment to prevent recurrent hemorrhage (Aghi et al 2006).
The most important risk factors that predispose to ICH are age and hypertension. Aging leads to increased degenerative changes of cerebral vessels that are at risk for rupturing. The increasing life span of the general population is one of the factors that lead to predications that the incidence of ICH may double during the next 50 years. Hypertension is the most common diagnosis in the adult population and easily is modifiable with the large armamentarium of antihypertensive treatments currently available. Yet, many individuals suffer from chronic hypertension because of failure to treat or poor compliance with medications. Chronic hypertension leads to lipohyalinosis, which includes degradation, fragmentation, and necrosis of small penetrating arteries. Arteriolar microaneurysms, known as Charcot-Bouchard aneurysms, can develop as a result of chronic hypertension. Rupturing of these microaneurysms or fragile vessel walls of small and medium-sized arteries during pressure spikes may result in extravasation of blood into the brain parenchyma. Hypertensive bleeds are associated mostly with deep or brainstem hemorrhages, but hypertension can contribute to risk of stroke in all brain locations (Hsieh et al 2006).
Cerebral amyloid angiopathy is the culprit for ICH in approximately 15% of cases and is the second most common cause of ICH. It occurs most commonly in elderly patients and the hemorrhage pattern more commonly is in lobar distribution. Cerebral amyloid angiopathy is not associated with systemic amyloidosis. Histologically, the small to medium vessels of the brain and leptomeninges are deposited with amyloid peptide. Deposition of the amyloid peptide leads to fragility of the vessel and results in lobar hemorrhages (Hsieh et al 2006).
Other precipitating factors related to spontaneous ICH include alcohol consumption, cocaine, amphetamine, antiplatelet therapy, coumadin usage, other anticoagulation, and systemic or intra-arterial recombinant tissue plasminogen activator therapy. Heavy alcohol consumption, particularly during a binge, can induce hypertension and inhibit platelet function. Cocaine, when snorted or smoked as crack, is known to be associated with ICH. In addition, cocaine may induce cerebral vasculopathy that predisposes to ICH (Hsieh et al 2006).
PATHOPHYSIOLOGY
Early Hematoma Enlargement
Most patients stop bleeding shortly after a spontaneous ICH. However, several recent prospective and retrospective studies have evaluated the rate of hematoma enlargement after initial presentation. Early enlargement of the hematoma after the ictus is associated with midline shift and accelerates neurological deterioration. A review of 627 patients with ICH by Fujii et al. reported that 14% of those patients demonstrated enlargement of their hematoma on CT scan within 24 hours of admission. Enlargement was defined as a 50% increase in volume or an increase of 20 cm3. Five factors were associated with enlargement: admission shortly after onset of symptoms, heavy alcohol consumption, irregular shaped hematoma, reduced level of consciousness, and low levels of fibrinogen. Mayer has proposed ultra-early hemostatic therapy with activated recombinant factor VII as a potential method of minimizing this early hematoma growth. Mayer postulates that such early therapy will prevent early neurological deterioration from hematoma growth. Recombinant factor VII is a medication originally designed to treat bleeding in hemophiliacs but also rapidly and safely corrects a several coagulopathies in patients who do not
have hemophilia (Xi et al. 2004).
Coagulation Cascade Activation and Clot Retraction:
The coagulation cascade is activated when blood enters the brain parenchyma. As soon as the hematoma forms, clot retraction begins and lasts for several hours. After completion of clot retraction, the hematocrit of the hematoma is approximately 90%, whereas the normal hematocrit of whole blood is half that. Clinical measurements of hematoma size are derived from CT scans. It should be noted that hemorrhage volume and hematoma size are different. Because the hematocrit in the clot can be as high as 90% because of clot retraction and the expulsion of serum, the initial hemorrhage volume in humans may be greater than the measured hematoma size by CT. For example, a 35-cm3 hematoma measured by CT scan might indicate an initial hemorrhage volume of 70 cm3. Serum from the clot accumulates around it for at least several hours and contributes to early perihematomal edema formation. Proteins from serum, such as thrombin and complement factors, could cause brain edema and cell death. Evidence indicates that thrombin formation plays an important role in inducing brain edema after ICH. In a rat ICH model, thrombin inhibition reduces brain edema and neurological deficits. This phenomenon is also found in humans. (Xi et al.2004)
Red Blood Cells and Hemoglobin:
Red blood cells within a clot preserve their normal biconcave configuration for a few days after an ICH. Thereafter, they lose their normal shape and start to lyse. Before RBC lysis, hemoglobin degrades into several forms, including oxyhemoglobin, deoxyhemoglobin, and methemoglobin. Immediately after ICH, the hematoma contains oxyhemoglobin, because the blood is well oxygenated. Oxyhemoglobin loses oxygen several hours later, converting to deoxyhemoglobin. Deoxyhemoglobin later denatures to methemoglobin, and ferrous iron oxidizes to the ferric form. RBC lysis occurs mostly 5 to 10 days in human.. However, RBC lysis can start early. Hemoglobin release from RBC lysis in a human parenchymal clot increases during the first few days after ictus.. Hemoglobin released from RBCs converts to hemosiderin after phagocytes engulf it. Hemosiderin is a coarse, orange intracellular pigment consisting of ferritin micelles within macrophages. Hemosiderin granules usually appear around a hematoma within 5 or 6 days after the ictus. Hematoidin, which consists of bilirubin, is a yellow nonferrous pigment that is usually extracellular. Bilirubin is another hemoglobin degradation product. Hematoidin usually becomes visible 10 days after ICH, both in the human and in a mouse ICH model. Eventually, the hematoma is replaced by a fibroglial scar or a cavity. RBC induced brain injury is hemoglobin mediated, because methemoglobin at concentrations found in RBCs mimic the effects of RBCs on edema formation. Our recent studies demonstrate that an intracerebral infusion of hemoglobin and its degradation products hemin, iron, and bilirubin, cause the formation of brain edema within 24 hours. In addition, an intraperitoneal injection of a large dose of deferoxamine (an iron chelator) attenuates brain edema induced by hemoglobin. These results indicate that hemoglobin causes brain injury by itself and through its degradation products. It has been reported that oxidative brain injury occurs after ICH and that antioxidative treatments improve neurological deficits in a rat ICH model induced by intracerebral injection of collagenase, but the source of oxidative stress is unknown. Our recent results showing that lysed RBCs increase protein carbonyl content in the brain indicate that RBC lysis during clot resolution may be a major source of this oxidative stress. Hemoglobin released during lysis and/or its breakdown products may be major factors in inducing the oxidative damage. In particular, iron has a central role in the generation of free radicals, and our finding that hemoglobin-induced brain edema is partially blocked by the iron chelator deferoxamine supports the hypothesis that iron has a role in hemorrhagic brain injury (Xi et al.2004).
Brain Edema:
Brain edema develops within minutes after an ICH, peaking several days later. In experimental models, perihematomal edema peaks on approximately the third or fourth day after the hemorrhage, and then declines slowly. The volume of edema actually may be larger than that of the hematoma itself. Edema formation after ICH is variable in humans, depending on clot size and localization. Brain edema around the hematoma is commonly observed during the acute and subacute stages after ICH, contributing to poor outcomes. Although the mechanisms of edema formation after ICH are not fully resolved, several mechanisms are responsible for edema development. These include hydrostatic pressure during hematoma formation and clot retraction, coagulation cascade activation and thrombin production, erythrocyte lysis and hemoglobin toxicity, complement activation, mass effect, secondary perihematomal ischemia, reperfusion brain injury, and blood-brain barrier (BBB) disruption. Various animal models of ICH have allowed detailed study of these mechanisms and their roles in the pathophysiological events that occur in brain tissue after ICH. There is an early phase (first several hours) involving hydrostatic pressure and clot retraction and a second phase (first two days) involving the activation of the coagulation cascade and thrombin production. We found that nonclotting heparinized autologous whole blood fails to produce perihematomal edema within 24 hours in rats and pigs. The same phenomenon also occurs in humans. In the Global Utilization of Streptokinase and Tissue Plasminogen Activator for Occluded Coronary Arteries trial, investigators found that brain edema around the clot is diminished in thrombolysis-related ICH compared with spontaneous ICH in patients with normal clotting. Thrombin, an essential component in the clotting cascade, is responsible for early brain edema development after ICH. Edema around a hematoma reaches its peak several days later. In rats, the edema peak occurs on the third or fourth day after experimental ICH. In contrast, thrombin- induced brain edema peaks within 48 hours This difference in time course led the authors to examine whether there might be a third phase (after 3 days) of injury involving RBC lysis and hemoglobin-induced neuronal toxicity. Infusion of packed erythrocytes causes edema after approximately 3 days, suggesting that RBCs are associated with delayed edema formation. A clinical study of edema and ICH indicates that delayed brain edema is related to significant midline shift after ICH in humans. This delayed brain edema formation (in the second or third weeks after the onset in humans) probably results from RBC lysis and hemoglobin degradation products. (Xi et al 2004).
Clinical presentation
Clinically, putaminal hemorrhages present with contralateral motor deficits, gaze paresis, aphasia, or hemineglect. Thalamic hemorrhages also present with contralateral sensory loss, pupillary and oculomotor abnormalities may coexist if the thalamic hemorrhage extends into the rostral brain stem. It is important to recognize cerebellar hemorrhages which present with nausea, vomiting, ataxia, nystagmus, decreased level of conciousness and ipsilateral gaze palsies or facial paralysis. Pontine hemorrhages are not subtle, presenting with coma, pinpoint pupils, disturbed respiratory patterns, autonomic instability, quadriplegia and gaze paralysis. Almost all pontine haemorrhages are fatal. Lobar haemorrhage presents according to the location (Manno et al. 2005).
INVESTIGATION
CT scan helps to confirm the existence of hemorrhage and localize its site. Bleeds as Small as 1 cm or less can be diagnosed by CT scan. The hematoma is usually seen as a hyperdense area within brain parenchyma with a value of 50-80 Hounsfield units. The location, the size as well as the volume of hematoma may be measured using specialized software. CT also shows clearly the degree and the extent of midline shift, the presence of intraventricular hemorrhage, evidence of herniation as well as associated hydrocephalus (Jha, 1996).
The volume of the hematoma can be approximated using the established practice of the modified ellipsoid volume = A X B X C/2 where A, B and C are the diameters of the clot in each of three orthogonal dimensions, with of dimension C, being superoinferior such that C= number of the slice with hematoma x slice thickness (kothari et al 1996).
MRI shows a marked difference in appearance between acute, subacute, and chronic hematomas. Acute hematomas, less than two days, appear hypointense or isointense in T1W mages and markedly hypointense in T2W images, especially at the centre After about 10 days the hematomas are bright both in T1W and T2W images. Thus in acute stage CT scan is more useful than MRI for diagnosis of intracerebral hematomas. MR is useful in subacute stage, especially those that involve the lower brainstem, as on CT such lesion may be isodence and obscured by bony artifact. MRI is useful in identifying any underlying lesion in acute cerebral hematomas like occult AVMs, primary or secondary neoplasia or venous angioma (Jha, 1996).
Cerebral angiography has extremely limited role in the diagnosis of hematomas, except when an aneurysm or an AVM is thought to be the cause of the blood clot or when the facilities for CT scan do not exist (Jha, 1996).
In 1997, Zhu XL et al. did a prospective study of 206 ICH cases. They suggest that diagnostic cerebralangiography should be considered for all spontaneous ICH patientsexcept those older than 45 years with preexisting hypertension inthalamic, putaminal, or posterior fossa hemorrhage.
Other investigations need to evaluate associated diseases such as diabetes, ischemic heart disease, hypertension etc. An ECG, chest x-ray chest and routine blood examination are performed along with the coagulation profile, as well as blood urea, serum creatinine and electrolyte levels.
TREATMENT STRATEGY
Initial management should first be directed toward the basics of airway, breathing, and circulation, and detection of focal neurological deficits. Four small randomized trials of medical therapy for ICH have been conducted, steroid versus placebo treatment, hemodilution versus best medical therapy and glycerol versus placebo. None of the 4 studies showed any significant benefit for the 3 therapies. In the study by Poungvarin et al. 8 patients who were treated with steroids were more likely to develop infectious complications than those treated with placebo. Thus, the medical guidelines below are based on the reported experience of treatment of ICH in clinical series as well as general guidelines for treatment of any acutely ill patient in a neuro–intensive care Unit (Broderick et al 1999).
Blood Pressure Management:
One third of subjects presenting with ICH continue to demonstrate hematoma expansion (with subsequent deterioration and death) in the first few hours after onset. An initial systolic BP ≥ 200 mm Hg is associated with hematoma expansion and increased mortality among patients with ICH. Persistently higher systolic BP is also associated with perihematoma brain edema formation. Reducing BP may reduce the rate of hematoma expansion, although conclusive evidence of this is not available. Recent studies suggest that reduction of BP may be tolerated because of reduced metabolism and preserved autoregulation in the perihematoma region. A multicenter prospective observational study reported the use of intravenous labetalol, hydralazine, and/or nitroprusside for maintaining BP < 160/90 mm Hg within 24 hours of symptom onset among patients with ICH. Low rates of neurological deterioration and hematoma expansion were observed in treated patients. Patients treated within 6 hours of symptom onset were more likely to be functionally independent at 1 month than patients who were treated between 6 and 24 hours. Another study 83 evaluated the tolerability and safety of intravenous nicardipine infusion within 24 hours of symptom onset to reduce and maintain MAP < 130 mm Hg, consistent with previous ASA guidelines. The primary outcome of tolerability was achieved in 86% of the patients. Low rates of neurological deterioration and hematoma expansion were observed among treated patients. Indirect comparisons suggest that intermittent intravenous bolus regimens of antihypertensive agents have greater variability in BP control than continuous infusion regimens (Qureshi 2008).
Management of Increased ICP:
ICP is considered a major contributor to mortality after ICH; thus, its control is essential. ICP may be managed through osmotherapy, controlled hyperventilation, and barbiturate coma. Elevated ICP is defined as intracranial pressure ≥ 20 mm Hg for >5 minutes. A therapeutic goal for all treatment of elevated ICP is ICP <20 mm Hg and cerebral perfusion pressure >70 mm Hg. The first medical line of defense is osmotherapy. Mannitol 20% (0.25– 0.5 g/kg every 4 h) is reserved for patients with progressively increasing ICP values, or clinical deterioration associated with mass effect. Due to its rebound phenomenon, mannitol is recommended for only ≤ 5 days. To maintain an osmotic gradient, furosemide (10 mg Q 2–8 h) may be administered simultaneously with osmotherapy. Serum osmolality should be measured twice daily in patients receiving osmotherapy and targeted to ≤ 310 mOsm. Corticosteroids in ICH are generally avoided because multiple potential side effects must be considered and clinical studies have not shown benefit. Hypocarbia causes cerebral vasoconstriction. Reduction of cerebral blood flow is almost immediate, although peak ICP reduction may take up to 30 minutes after PCO2 is changed. Reduction of PCO2 to 35–30 mm Hg, best achieved by raising ventilation rate at constant tidal volume (12–14 ml/kg), lowers ICP 25% to 30% in most patients. Failure of elevated ICP to respond to hyperventilation indicates a poor prognosis (Broderick et al 1999).
Fluid Management:
Isotonic IV fluids should be initiated and adjusted to correct for any electrolytes abnormalities. Fluid balance is calculated by measuring daily urine production and adding for insensible water loss (urine output plus 500 ml for insensible loss plus 300 ml per degree in febrile patients). The goal is to achieve euvolumia and to maintain adequate intravascular volume to optimize cerebral perfusion. Hypervolumia worsen cerebral edema and should be avoided. Glucose-containing solutions also should be avoided except in patients with symptomatic hypoglycemia. Hyperglycemia is detrimental to damaged brain and should be corrected. However, this correction should occur slowly because a rapid decrease in the serum glucose level decreases serum osmolality and may worsen cerebral edema (Broderick et al 1999).
Prevention of Seizures:
Seizure activity can result in neuronal injury and destabilization of an already critically ill patient and must be treated aggressively. Additionally, nonconvulsive seizures may contribute to coma in ≤ 10% of neuro–critical care patients. In patients with ICH, prophylactic antiepileptic therapy (preferably phenytoin with doses titrated according to drug levels [14 to 23 mg/ml) may be considered for 1 month and then tapered and discontinued if no seizure activity occurs during treatment, although data supporting this therapy are lacking (Broderick et al 1999).
Surgical Treatment:
Considerable controversy exists regarding indications of surgery. Surgery may lower morbidity from rebleeding, edema or necrosis from mass effects of hematoma but rarely causes neurological improvement.
Guidelines for considering surgical management (Greenberg 2006):
A. Symptomatic lesion (hemiparesis/hemiplegia, aphasia, however may present only as agitation or confusion).
B. Lesions with marked mass effects, edema or midline shift on imaging.
C. More than moderate volume of hematoma (10-30 c.c); surgery may be more appropriate than large (>30 cc) or small (<10 cc).
D. Persistent elevated ICP inspite of therapy (failure of conservative treatment)
E. Rapid deterioration (especially with sign and symptoms of brain stem compression) regardless the location.)
F. Cerebellar Hemorrhage: Patients with GCS ≤ 13 or with a hematoma ≥ 4 cm.
Choice of Surgical Treatment:
1. Burrhole aspiration: Simple aspiration of ICH through a burrhole is relatively noninvasive and associated with low morbidity than craniotomy.(Broderick et al, 1992)
2. Open craniotomy: Craniotomy has been the standered approach for the removal of ICH. The major advantage is adequate exposure to remove the clot. More complete clot removal reduces the elevated ICP and local pressure effects of the blood clot on the surrounding brain. In case of cerebellar hematoma craniectomy is preferred over craniotomy to accommodate post operative swelling.
3. External ventricular drainage (EVD): Especially applied for any hemorrhage with ventricular extension.
4. Craniectomy: Hemorrhage in posterior fossa and temporal lobe.
5. Stereotactic approach: CT guided stereotectic technique has been proposed in patient with deep thalamic hematoma.
6. Endoscopic evacuation: It is not clear that whether these procedures significantly change the outcome in this difficult problem but Braus et al 1992, found a lower mortality rate after stereotectic evacuation of ICH.
METHODOLOGY
Study Design:
This was a prospective study.
Duration of the Study:
April 2009 to October 2010.
Place of Study:
Department of Neurosurgery, BSMMU, Shahbag, Dhaka-1000.
Study Population:
Patients of spontaneous intracerebral hemorrhage who underwent surgery during this period.
Sample Selection:
Inclusion criteria:
A) Patients who had history of spontaneous intracerebral hemorrhage.
B) Patients who had CT scan evidence of intracerebral hemorrhage.
C) Patients who underwent craniotomy / craniectomy for evacuation of spontaneous intracerebral hemorrhage.
Exclusion criteria:
A) Patients needed the artificial maintenance of respiration.
B) The patients who underwent burr hole and aspiration or only external ventricular drainage.
Sample Size:
n = [Zα √ 2P (1-P) + Zβ √ P1( 1- P1) + P2 ( 1- P2 ) ]2 / ( P1-P2 )2
Here,
P1 = Anticipated probability of outcome in exposed group / higher risk group.
P2 = Anticipated probability of outcome in unexposed group / higher risk group.
Zα = Z- Value at a definite level of significance e.g. 1.96 at 5% level of significance.
Zβ = Z- Value at a definite power e.g. 1.28 at 90% power (when β = 0.10)
n = [Zα √ 2P (1-P) + Zβ √ P1( 1- P1) + P2 ( 1- P2 ) ]2 / ( P1-P2 )2
P1 = 95%= 0.95 P= P1 + P2/2
P2 = 70% = 0.70 =0.70+ 0.95/2 =1.65/2= 0.83
Zα √ 2P (1-P) Zβ √ P1 (1- P1) + P2 (1- P2)
= 1.96 √ 2× 0.83× (1- 0.83) =1.28√ 0.95(1- 0.95) + 0.70 (1- 0.70)
=1.96√ 1.66 × 0.17 = 1.28 √ 0.95 × 0.05 + 0 .70 × 0.30
= 1.96 × √ 0.28 = 1.28 √ 0.05+ 0.21
=1.96 × 0.53 = 1.28 × 0.51
=1.04 = 0.65
n = [Zα √ 2P (1-P) + Zβ √ P1( 1- P1) + P2 ( 1- P2 ) ]2 / ( P1-P2 )2
= [1.04 + 0.65]2 / (0.95- .70)2
= (1.69)2 / 0.252 = (2.86)2 / 0.06 = 47.6
So Sample size will be 48. (Fernandes et al. 2002)
Sampling Techniques:
Non-probability purposive sampling was done.
Grouping of the Study Subjects:
Patients of ICH were divided into two groups: lower risk group & higher risk group. Patient of lower risk group had ICH score 0 and 1 and higher risk group had ICH score 2, 3,4,5,6. 38% of the patients with a score of 0 and 70% with a score of 1 were not independent at neurosurgical discharge. 98% of the patients with a score of 2 and 95% of the patients with a score of 3 were not independent at their hospital discharge (Fernandes et al. 2002).
Data Collection Procedure:
Review of records of spontaneous intracerebral hemorrhage patients who underwent surgery in neurosurgery department, BSMMU and Dhaka medical hospital, Metropoliton medical center and Greenlife hospital (pvt) Ltd during their admission in hospital. After discharge of the patients from the hospital, follow-up was done at hospital outdoor or by structured interviews with the patient or relatives over telephone for assessing the Glasgow outcome scale in their 30th post ictus day.
Research Instrument:
Data collection sheet.
Study Procedure:
1) Data regarding history and physical examination was collected from the history sheet.
2) Findings of the CT scan were recorded.
3) Results of ancillary investigations (Blood sugar, Serum electrolytes, Blood urea and Serum creatinine) were recorded.
4) Status of the patient at regular follow ups was recorded in the data collection sheet. Data regarding surgical outcome of the patient was recorded during their hospital stay or by structured interviews for the Glasgow outcome scale for the discharged patients over telephone in their 30th post ictus day (Pettigrew et al. 2003).
Measurement of Outcome Variables:
A) Demographic and clinical variables:
– Age and sex of the patients.
– Predisposing factors:
– Hypertension and DM.
– Glasgow coma scale on admission.
B) Imaging variables: These are measured from the CT scan of brain and following variables will be studied:
– Size of the hematoma: The volume of hematoma was measured by modified ellipsoid formula by π/6 ABC ( kothari et al. 1996) .
– Presence of hemorrhage in relation to tentorium.
– Presence of intraventricular extension.
C) Surgical out come variables:
– Glasgow out come scale.
Intracerebral Hemorrhage Score (ICH Score):
The ICH Score, a simple and reliable scale, determining the 30-day mortality and the functional outcome. It is easy to determine and it is reproducible.
Surgical Outcome:
In this study the term surgical outcome was used to designate the outcome at 30th post ictus day by Glasgow outcome scale.
Sore-5: Good recovery, resumption of normal life despite minor deficit (‘Return to work’ not reliable)
Score-4: Moderate disability (Disable but independent) – travel by public transportation, can work in sheltered setting (exceeds mere ability to perform “Activity of daily living”)
Score-3: Severe disability (Conscious but disabled) – Dependent for daily support.
Score-2: Persistent vegetative state – Unresponsive and speechless; after 2-3 weeks. May open eye and have sleep / wake cycles.
Score-1: Death.
Structured Interviews For The Glasgow Outcome Scale (Over Telephone).
Q1. Vegetative State.
If the patient is unable to obey commands or say words for some other reason, for example, because they are severely demented, then they are not in the vegetative state. “Any words” includes repetition of a simple word such as “No”. A person able to communicate using a code would no longer be in the vegetative state.
Q2. Independence in the Home.
Examples of minor domestic crises: what you do if … a glass gets dropped and broken, a tap is left running, a light goes out, it begins to get cold, and a stranger comes to the door. The person should be able to use the telephone to report problems or summon help.
Q3. Shopping & Q4. Travel: Independence Outside The Home.
Independence outside the home requires ability to plan, to take care of money, and behave appropriately in public. It must be established if the person is actually capable of carrying out these activities, rather than whether they do or not.
Q5. Work.
“Work” refers to jobs that are paid at a reasonable rate and which, in principle at least, are open to others. “Reduced capacity for work”-Any of the following indicate reduced capacity for work: (a) change in level of skill or responsibility required; (b) change from full-time to part-time working; (c) special allowances made by employer (e.g., increased supervision at work); and (d) change from steady to casual employment (i.e., no longer able to hold steady job). Note that sometimes change in employment status may be unrelated to head injury, e.g., due to end of contract, retirement, or redundancy. Such changes do not indicate a reduced capacity for work.
Q6. Social & Leisure Activities.
Social and leisure activities will vary depending on the age and background of the patient. Representative social & leisure activities reported by patients include the following: (a) participating in sport, e.g., football, swimming, etc., (b) attending sporting events as a spectator, (c) going walking, (d) going to a club or pub, and (e) visiting friends. Some leisure activities are seasonal, and one must be careful to exclude changes in activity that is simply due to this factor. Typical problems that may interfere with social and leisure activities: lack of motivation or initiative, avoidance of social involvement, physical problems such as loss of mobility, cognitive problems such as poor concentration, problems such as poor temper control or impatience.
Q7. Family & Friendships.
Q7a. The question is specifically aimed at alterations in relationships as a result of head injury. The presence of a reported change in personality is not of itself sufficient to warrant classifying the person as moderately disabled – the change must be having an adverse impact on family and friendships.
Q7b. Extent of disruption or strain. The following definitions apply: (a) Occasional – Some problems since injury, but less than once a week and not causing continuous strain. For example, occasional bad temper, but things blow over. (b) Frequent – Problems at least weekly, strain on relationships, but regarded as tolerable. For example, temper outbursts at least once a week resulting in modification of closeness of relationships. (c) Constant daily problems – Breakdown or threatened breakdown of relationship within family or friendship; problems regarded as intolerable. If a family has become very withdrawn and socially isolated as a result of injury, then this also represents constant disruption. (Wilson et al. 1998)
Ethical Consideration:
A) Prior to commencement of this study the research protocol was approved by the ‘Central Ethical Committee’ of BSMMU.
B) The aims and objectives of the study along with its procedure, diagnostic methods, risk and benefits of this study was explained to relatives or attendants of the patient in easy understandable local language and then informed consent was taken for each patient.
C) It was assured that all the information and records will be kept confidential.
Data Analysis Procedure:
1) Patients of ICH were divided into two groups: lower risk group & higher risk group. Patient of lower risk group had ICH score 0 and 1 and higher risk group had ICH score 2, 3,4,5,6.
2) Collected data of each patient was verified and entered into a SPSS (statistical package for social science, 12th edition ) computer software program for analysis.
3) The probability of association between risk group and outcome was analyzed by chi-square test. Statistical calculation (Pearson’s correlation co efficient test) was performed to see the relationship between intracerebral hemorrhage score and surgical outcome of intracerebral hemorrhage if there is any. In this study level of significance was 5% and power of test was 95%.
Age distribution of patients
Table : Age distribution of patients
Age Group (Years) | No of Patients | Percentage |
< 40 | 1 | 2.38 |
40 – 49 | 7 | 16.28 |
50 -59 | 15 | 34.88 |
60 -69 | 11 | 25.58 |
70 -79 | 6 | 13.95 |
≥80 | 3 | 6.98 |
Total | 43 | 100.00 |
Above table shows the age distribution of the patient with ICH. The age ranged from 28 years to 82 years. The peak age incidence of intracerebral hemorrhage (ICH) was found in 50-59 years age group.
Surgical outcome of patients in relation to age
Table : Surgical outcome of patients in relation to age
Age of Patients (Years) | ||
Surgical outcome
χ2
p value
Favorable outcome
Unfavorable outcome
1.248
0.26
< 80
12
28
≥80
0
3
Above table shows the surgical outcome of patients with ICH in relation to age. 12 patients had favorable outcome and 28 patients had unfavorable outcome who had age < 80 years. All 3 patients of ≥ 80 years age had unfavorable outcome. Relation between age and surgical out come was not statistically significant (P = 0.26).
Sex distribution of patients with ICH
Table : Sex distribution of patients with ICH
Sex of Patients | No. of Patients | Percentage |
Male | 34 | 79.07 |
Female | 9 | 20.93 |
Total | 43 | 100.00 |
Above table shows the sex distribution of patients with ICH .In this study, out of 43 patients of ICH, 34(79.07%) were male and 9(20.93%) were female. The male to female ratio was 3.78:1.
Distribution of patients by precipitating factors
Table : Distribution of patients according to precipitating factors
Precipitating factors | No. of Patients | Percentage
|
Hypertension | 25 | 58.14 |
Diabetes | 1 | 2.33 |
Hypertension & Diabetes | 8 | 18.60 |
Nil | 9 | 20.93 |
Above table shows in this study, out of 43 patients with ICH the most important precipitating factor is Hypertension (58.14%). Diabetes (2.33%) is the second most precipitating factor. Combination of Hypertension and Diabetes (18.60%) showed a significant role in precipitating in ICH.
Distribution of patients by presenting GCS
Table : Distribution of patients by presenting GCS
GCS | No. of Patients | Percentage |
3-4 | 3 | 6.98 |
5-12 | 37 | 86.05 |
13-15 | 3 | 6.98 |
Above table shows in this study out of 43 patients 3 patients (6.98%) had GCS between 3and 4, 3 patients (6.98%) had GCS between 13 and 15. 37 (86.05%) patients of ICH had GCS between 5and 12.
Surgical outcome of patients in relation to presenting GCS
Table : Surgical outcome of patients in relation to presenting GCS
GCS | ||
Surgical outcome
χ2
p value
Favorable outcome
Unfavorable outcome
9.147
0.01
3-4
0
3
5-12
9
28
13 -15
3
0
Above table shows that all the 3 patients of GCS, 3-4 had unfavorable outcome. In GCS 5-12 group 9 patients had favorable outcome and 28 patients had unfavorable outcome. In GCS 13-15 group all the 3 patients had favorable outcome. Relation between surgical outcome and presenting GCS was found statistically significant (P = .01)
Distribution of patients by volume of the hematoma
Table : Distribution of patients by volume of the hematoma
Size of the hematoma ( cc) | No. of Patients | Percentage |
< 30 | 4 | 10 |
≥ 30 | 36 | 90 |
Above table shows in this study, out of 40 patients 4 patients (10%) had hematoma volume < 30 cc and 36 patients (90%) patients had hematoma volume ≥ 30 cc.
Surgical outcome of patients in relation to volume of the hematoma
Table : Surgical outcome of patients in relation to volume of the hematoma
Volume of the Hematoma
( cc )
Surgical outcome
χ2
p value
Favorable outcome
Unfavorable outcome
< 30
3
1
5.722
0.05
≥ 30
9
27
Above table shows in this study 4 patients had volume of hematoma < 30 cc, among them 3 patients had favorable outcome and 1 patient had unfavorable outcome. 36 patients had volume of hematoma ≥ 30 cc. Surgical outcome of patients in relation to volume of the hematoma was found statistically significant (P = .05).
Distribution of patients by location of ICH in relation to tentorium.
Table : Distribution of patients by location of ICH in relation to tentorium
Location | No. of Patients | Percentage |
Supratentorial | 40 | 93.02 |
Infratentorial | 3 | 6.98 |
Total | 43 | 100.00 |
Above table shows in this study, out of 43 patients 40 patients (93.02%) had hematoma above the tentorium and 3 patients (6.98%) had hematoma below the tentorium.
Surgical outcome of patients in relation to tentorium.
| Location | Surgical outcome | χ2 | p value | |
Favorable outcome | Unfavorable outcome | |||
Supratentorial | ||||
12
28
1.248
0.2
Infratentorial
0
3
Table : Surgical outcome of patients in relation to tentorium
Above table shows out of 40 supratentorial hematoma 12 had favorable outcome and 28 had unfavorable outcome. All 3 patients of infratentorial hematoma had unfavorable outcome. Surgical outcome of patients in relation to tentorium was found statistically not significant (P = .02).
Distribution of patients by ventricular extension
Table: Distribution of patients by ventricular extension
Ventricular Extension | No. of Patients | Percentage
|
Present | 19 | 44.19 |
Absent | 24 | 55.81 |
Total | 43 | 100.00 |
Above table in this study, out of 43 patients 19 patients (44.19%) had ventricular extension and 24 patients (55.81%) did not have ventricular extension.
Surgical outcome of patients in relation to ventricular extension
Table : Surgical outcome of patients in relation to ventricular extensio
Ventricular Extension | ||
Surgical outcome
χ2
p value
Favorable outcome
Unfavorable outcome
Present
2
17
5.94
.01
Absent
9
15
Above table in this study, out of 19 patients 19 patients who had ventricular extension 2 patients had favorable outcome and 17 patients had unfavorable outcome. Out of 24 patients who did not have ventricular extension 9 patients had favorable outcome and 15 patients had unfavorable outcome. Surgical outcome of patients in relation to ventricular extension was found statistically significant (P = .01).
Distribution of patients by ICH score
Table: Distribution of patients by ICH score
ICH Score | No. of Patients | Percentage |
0 | 1 | 2.33 |
1 | 4 | 9.30 |
2 | 14 | 32.56 |
3 | 17 | 39.53 |
4 | 5 | 11.63 |
5 | 1 | 2.33 |
6 | 1 | 2.33 |
Total | 43 |
100.00
Above table shows in this study, out of 43 patients 17 (39.53%) patients had ICH score 3 followed by 14 (32.56%) patients who had ICH score 2. 5 (11.63%) patients had ICH score 4 and 4 (9.30%) patients had ICH score 1.
Distribution of patients by Glasgow Outcome Scale
Table : Distribution of patients by Glasgow Outcome Scale
Glasgow Outcome Scale | No. of Patients | Percentage |
Favorable Outcome | 12 | 27.91 |
Unfavorable Outcome | 31 | 72.09 |
Total | 43 | 100.00 |
Above table shows in this study, out of 43 patients 12 (27.91%) patients had favorable outcome and 31 (72.09%) patients had unfavorable outcome.
Distribution of patients by risk group in relation to Glasgow Outcome Scale
Table : Distribution of patients by risk group in relation to Glasgow Outcome Scal
ICH Score | Favorable Outcome | Unfavorable Outcome | χ2 | p value |
Lower risk group (ICH Score: 0-1) | 4 | 1 | 7.63 | .006 |
Higher risk group (ICH Score: 2-6) | 8 | 30 |
Above table shows in this study, out of 43 patients 5 patients was in lower risk group in whom 4 patients had favorable outcome and 1 patient had unfavorable outcome. In higher risk group out of 38 patients 8 patients had favorable outcome and 30 patients had unfavorable outcome. Risk stratification in relation to Glasgow Outcome Scale was found statistically highly significant (P = .006).
Correlation between ICH score with Glasgow Outcome Scale
Table : Correlation between ICH score with Glasgow Outcome Scale
ICH score | Glasgow Outcome Scale | |||||
Total
1
2
3
4
5
0
0
0
0
0
1
1
1
1
0
0
0
3
4
2
2
1
4
6
1
14
3
6
2
8
1
0
17
4
4
1
0
0
0
5
5
1
0
0
0
0
1
6
1
0
0
0
0
1
Total
15
4
12
7
5
43
( r = -0.635, P = 0.001 )
Correlation between intracerebral hemorrhage score with Glasgow Outcome Scale was done and found statistically highly significant (P = .001). Negative correlation between intracerebral hemorrhage score with Glasgow Outcome Scale was found.
DISCUSSION
Spontaneous intracerebral hemorrhage (ICH) comprises 10–15% of all strokes and remains without a proven beneficial medical or surgical treatment (Caplan 1992). Although general guidelines exist to manage ICH, there remains great heterogeneity regarding the application of various surgical and medical therapies for ICH treatment (Guidelines for the management of spontaneous intracerebral hemorrhage: A statement for healthcare professionals from a special writing group of the Stroke Council, American Heart Association. 1999). This heterogeneity is also reflected in differences in enrollment criteria for studies of ICH treatments. A better understanding of prognosis and associated factors in ICH could reduce variability in clinical trials and in clinical management by allowing more effective targeting of therapies. Despite the existence of several detailed prognostic models for outcome after ICH, there is no clinical grading scale for ICH that is consistently used as part of either clinical care or clinical research. To provide a simple clinical grading scale for ICH, the ICH score was developed, which is comprised of several factors associated with outcome that can be easily assessed at the time of acute ICH presentation. In this study we want to see the correlation between intracerebral hemorrhage score with surgical outcome of spontaneous intracerebral hemorrhage.
study was carried out in the Department of Neurosurgery, BSMMU, Dhaka during the period of April 2009 to October. 43 patients of spontaneous intracerebral hemorrhage were included in the study and surgical outcome was assessed at their 30th post ictus day.
The age range was from 28 to82 years. The Mean ± SD of age was 57.95 ± 12.38. In 2001 Hemphill et al. found mean age was 66 ± 15 years (range, 22 to 91 years) and 78% patients of their study had age < 80 years and 22% patients had age ≥ 80 years. In this study 6.89% patients had age ≥ 80 years. Age above or below 80 years was not found significant relationship with the surgical outcome of spontaneous intracerebral hematoma. Possible reason was that number of parients ≥ 80 years was small and they present by low GCS. This study had male predominance (Male 79% and Female 20.93%).
In this study hypertension 25 (58.14%) was found very important predisposing factor for spontaneous intracerebral hemorrhage. Diabetes and hypertension was predispose 8 (18.60%) patients. Total 77% patients had hypertension in our series and in 2001 Hemphill et al had 73% hypertensive patients in their series.
Because GCS score is most strongly associated with outcome, it was given the most weight in the scale. The GCS was divided into 3 subgroups (GCS scores of 3 to 4, 5 to 12, and 13 to 15) to more accurately reflect the very strong influence of GCS score on outcome. In 2001 Hemphill et al found that 1 of 35 (2.9%) patient with a presenting GCS score of 3 or 4 survived to 30 days, and only 5 of 60 (8.3% ) patients with a presenting GCS score of 13 to 15 died, whereas 29 of 57 (50.8%) patients with a GCS score of 5 to 12 died within 30 days. In our study their was 3 patients presenting with GCS score of 3 or 4 and all (100%) were died, with 37 patients with a GCS score of 5 to 12, 9 patients had favorable outcome and all 3 patients with a GCS score of 13 to 15 had favorable outcome. GCS was found to had significant relationship (p=0.01) with the surgical outcome of spontaneous intracerebral hematoma.
Volume of hematoma is another very important in management of ICH patient. In this study the volume of hematoma ranged from 21 cc to 150 cc and 4 (10%) patients hadhematoma volume <30 cc with 30 (90%) patients had hematoma volume ≥30 cc .Volume of the hematoma found significant (p=0.05) relationship with the surgical outcome of spontaneous intracerebral hematoma. In 2001 Hemphill et al found that volume of the hematoma also had statistical significance (p = 0.047).
The location of the hematoma in relation to tentorium was another important factor regarding the outcome of spontaneous intracerebral hematoma. In this study 40 (93.02%) patients had hematoma above the tentorium and 3 (6.98%) below the tentorium. Location of the hematoma was not found to had significant (p=0.02) relationship with the surgical outcome of spontaneous intracerebral hematoma.
In 2001 Hemphill et al found that ICH with ventricular extension had a higher mortality of 66% compared with patient without ventricular extension 19%. In this study 19 (44.19%) patients had ventricular extension and 24 (55.81%) patients without ventricular extension. In this study ventricular extension had significant (p=0.01) relationship with the surgical outcome of spontaneous intracerebral hematoma..
In our study 1(2.33%), 4(9.30%), 14(32.56%), 17(39.53%), 5(11.63%), 1(2.33%), 1(2.33%) patients had ICH score 0, 1, 2,3,4,5 and 6 consecutively. In 2003 Fernandes et al found 88 (22%), 97(25%), 116 (30%), 74 (19%), 17 (4%), 1(<1%) patients had ICH score 0, 1, 2,3,4, and 6 consecutively. In their study they had more patients with ICH score 0 and 1 than our study as they had good referral system than us, that’s why they had good outcome compare to us.
In this study 12 patients had favorable outcome and 31 patients had unfavorable outcome. 1 (100%) patient of ICH score 0 and 3 patients out of 4 (75%) of ICH score 1 were independent at their 30th post ictus day. In 2003 Fernandes et al. found that they had 70% patient of ICH score 0 and (30%) of ICH score 1 were independent at their hospital discharge. We had better outcome as our sample size was small than Fernandes. On other side 7(50%) patients with ICH score 2 and 1(2.8%) patient with ICH score 3 were independent at their 30th post ictus day. In 2003 Fernandes et al found that they had 2 % patient of ICH score 2 and 5% of ICH score 3 are independent at their hospital discharge. In this study in the patients with ICH score 2 more better outcome was found because we did the outcome at their 30th post ictus day. Fernandes et al recorded outcome at neurosurgical discharge, which was on average 2 to 4 weeks after ictus. So we can include ICH score 2 patients in the lower risk group as they had significant (50%) outcome. In this study risk stratification in relation Glasgow Outcome Scale was found statistically highly significant (P = .006).
In 2001 Hemphill et al found that thirty-day mortality rates for patients with ICH Scores of 1,2, 3, and 4 were 13%, 26%, 72%, and 97%, respectively. Lower ICH score had better outcome . In 2003 Fernandes et al showed same type of relation. In this study the relation between ICH score and surgical outcome of spontaneous intracerebral hematoma was found highly significant (p= 0.001) and they had inverse relation. The low the ICH score the better the outcome.
Limitation of the Study
1. Sample size was small so it was not possible to generalize the findings to my reference population.
3. It was a single centre study.
4. Follow up after discharge was short.
5. There should have more facilities in terms of skilled persons and equipments.
CONCLUSION AND RECOMMENDATIONS
The ICH Score is a simple clinical grading scale that allows risk stratification of patients with ICH. As correlation between ICH score and surgical outcome of spontaneous intracerebral hematoma was found statistically very significant it can be use widely as a grading scale in preoperative counseling. The use of ICH Score could improve standardization of clinical treatment protocols and clinical research studies in ICH.